A GAME THEORETICAL APPROACH TO OBAMA’S SCOTUS NOMINATION

Obama nominated Merrick Garland to fill the vacant seat on the Supreme Court nearly five months ago. Garland is well liked by both conservatives and liberals, and could reasonably be considered the embodiment of non-partisanship and legal expertise. Garland was chosen for precisely this reason. Obama knew that any left-winger would never get a hearing by the Republican-led Senate, and that a moderate was the only chance he had to fill the seat before his second term expired. However, the Republicans have, nonetheless, continued to refuse to hold a hearing on the matter, and this is actually their best play at this point.

Merrick Garland is well-credentialed, and there is no objectively good reason for denying him an appointment to the court. To hold a hearing puts Garland in front of a microphone and exposes to the American people why he is such a good choice. To do that and then vote to reject him would unveil blatantly extreme partisanship. However, to hold a hearing and then vote to appoint him to the Court would show that Republicans had “caved to Obama,” and I think we all know that they don’t want that kind of press only a few months before the election. Thus, in the end, this is the reason I believe that not holding a vote is theoretically the Senate Republicans’ best possible play.

This strategy made more sense during the Republican primaries, while it was still unknown who the eventual nominee would be – i.e., would it be someone who has a chance to win the general election? But, now that Donald Trump has been crowned the nominee, it is highly likely that Hillary Clinton will win the presidency. So how will the Garland nomination unfold given this assumption?

  1. Hillary Clinton would have every incentive to nominate a highly liberal judge for the empty seat on the SCOTUS. If the Democrats take back the Senate, and I believe that they will, this becomes entirely feasible and will represent quite a large ideological shift within America’s highest court.
  2. If Hillary wins the general election, or if it begins to even appear as though she will win in the weeks leading up to November, current Senate Republicans have every incentive to hold a hearing and vote to put Garland on the Court so that Hillary is unable to nominate a more liberal candidate.
  3. If Hillary wins, or if it begins to even appear as though she will, Obama then has every incentive to rescind his nomination of Merrick Garland (before the Senate Republicans frantically try to vote him in) so that Hillary can shift the Court even further left.
  4. Rescinding Garland’s nomination is quite a cruel thing to do, and on its surface it feels like something that would adversely impact Obama; i.e. it’s “playing politics with the Court,” right? No, and Republicans will be unable to use this as an argument. This is because Obama can simply state that Senate Republicans were obviously uninterested in Garland’s candidacy, as they have had months to vote on him and never did, so in return, he withdrew the nomination. He would be “giving them what they wanted.”

This whole story is a perfect representation of the inability for Republicans to work with the Obama administration, the paralysis in Congress, and to be frank, it is quite disheartening to me personally. If Trump wins, who knows what will happen or who he will nominate. Regardless, I strongly believe that Garland will never make it on the Court no matter who wins in November.

-Tyler

DEMOCRATIC PRIMARY PROJECTIONS: KENTUCKY AND OREGON

As you all know, I’m just a graduate student with no income. If you would like to support my work and want me to be able to afford Top Ramen (or maybe even Mellow Mushroom pizza if you all are extraordinarily generous) while I’m working on these statistics, please click this link to donate to Tyler’s Food & Rent Fund!


I am estimating that Bernie Sanders will win both primaries tomorrow, in Kentucky and Oregon. Using my metrics, Oregon seems poised to be a blowout Sanders victory, while Kentucky stands to be a hard-fought battle between both candidates for a win. I have put together an entirely new framework over the past week to account for votes going to other candidates, which is where my West Virginia projection fell most short. It is a more comprehensive model, and should be more accurate. For anyone concerned, my old model is generating very similar estimates for tomorrow. Here they are:

Screen Shot 2016-05-16 at 6.47.10 PM

KENTUCKY

The demographics of Kentucky favor Bernie Sanders. It is a white state with only a 7.8% African American population, similar to that of Kansas (5.9%), Wisconsin (6.3%), and Indiana (9.4%), all states that he has previously won. 7.8% is approximately at one standard deviation from the mean Black population percentage (4.2%) of the states that Bernie has won, meaning that it is not too far out of the ballpark for a Sanders victory. Bernie has also done quite well with campaign contributions in Kentucky, with the logged value of the relative number of <$200 contributions being 0.337. This is slightly under the average of states that he has won, 0.366, but far higher than the average of the states that he has lost, -0.07. These reasons are the primary drivers of my estimated Sanders victory.

Bernie’s Facebook presence in the state is poor, 73.91%, which is lower than any state he has won at this point. Bernie’s relative search interest in Kentucky is poor as well, with the three-day average currently at 0.927. The mean three-day average for all the states that he has won is 2.167, though just last week he won West Virginia at a relative search interest value of 0.94.

Lastly, Kentucky has a closed primary electoral format, which Bernie has never won before. Regardless of who actually wins the Kentucky primary tomorrow, I believe it will be a very close race.

Screen Shot 2016-05-16 at 7.32.23 PM

OREGON

Oregon is Bernie’s best state with the exception of Vermont when it comes to Facebook data. He has 84.314% of Democrat Facebook Likes, similar to Idaho (84.0%), Maine (84.09%), and Alaska (83.87%) (Vermont was 95.00%). Demographically, Oregon is about as good as it gets for Bernie. The African American population is only 1.8%, similar to Hawaii (1.6%), Utah (1.1%), and Alaska (3.3%). Only in Vermont and Alaska did Bernie outpace Hillary to a greater extent than in Oregon in the relative number of <$200 campaign contributions. These are the primary drivers of the massive margin of victory that I am projecting. It is difficult to reconcile the one and only poll (that showed Hillary with a 15% lead… but also had 19% undecided… and was also conducted well after ballots had already been received and presumably had already been mailed off by many voters) conducted in Oregon with this projection, but I refuse to arbitrarily tack on extra points because I have a hunch about something.

Oregon is entirely vote by mail. Clinton has traditionally dominated early voting, but Oregon’s format is unique to all the states that have already voted, so it is difficult to predict how much of an effect this will have. Personally, I doubt it will be significant due to practically every metric being overwhelmingly in Bernie’s favor (imagine Vermont was only vote-by-mail, would that have really changed the result?). Also, the party registration deadline was recent, April 26th. Bernie’s current relative search interest is quite low, but Oregonians began receiving their ballots two-three weeks ago. If we go back in the Google Trends data to April 26th (around the day voters began receiving ballots), Bernie’s relative search interest for the next week and a half was around 1.45; not bad. The average for all the states he has won is 2.167, but the standard deviation is 0.61, so 1.45 is not indicative of anything particularly remarkable.

Lastly, Oregon is also a closed primary, which Bernie Sanders has never won before.

Screen Shot 2016-05-16 at 7.33.22 PM

If the above estimates are correct, this should give Hillary Clinton a ~24 delegate deficit tomorrow. Good luck to both candidates, and happy voting to all you Oregonians and Kentuckians!

-Tyler

DEMOCRATIC PRIMARY PROJECTION: INDIANA

I’m only aware of one other outlet that is projecting a Clinton loss tomorrow in Indiana. Though Bernie Sanders has scaled back spending in Indiana, Hillary has cut all spending from states that have yet to vote in the Democratic primaries, presumably to save funding for the general election campaign against Trump (edgy assumption, I know). This Clinton spending cut seems to be showing up in the Google Trends data for Indiana, as Bernie has seemed to have drastically increased his search interest relative to Hillary. Here are my estimates for what we will see tomorrow night:

Screen Shot 2016-05-02 at 8.01.28 PM

Something about this projection doesn’t feel very right to me, though I suppose this concern is rooted in the surprisingly consistent polling results showing Hillary with a win. Despite this, every different configuration of my model, six total, is showing a Bernie win in Indiana. I have devoted quite a bit of time over this past week trying to see if it was possible to generate a different result, but it just wasn’t possible within my framework. Perhaps Hillary will win, and perhaps Hillary will lose, but regardless, I do think it will be very close.

There doesn’t seem to be any particular factor within all of my data that is significantly driving this result, though if I had to choose one I suppose it would be his slightly higher-than-average share of Facebook likes within the state, 78.5%, similar to Michigan (80.0%), Kansas (78.5%), Illinois (76.1%), and Missouri (76.9%). The Republican open primary that is being held tomorrow in Indiana will help Hillary by stealing independents that would’ve voted for Bernie, likely by around 0.4% (already factored into the above projection).

Michigan is perhaps the best analogue for Indiana. The Facebook data is very similar, and they are both open primaries. I believe that both have also had a minimal amount of early voting. One somewhat stark difference between the two states are the respective portions of the populations that are African American, with Michigan at 14.2% and Indiana at 9.4%, so Bernie should gain an advantage over Michigan in this respect. However, in Michigan, Bernie had a higher relative search interest measure (from Google Trends), about 14% higher. Bernie also had a higher number of individual campaign contributions in Michigan compared to Indiana; where he had about 1.56 times more <$200 contributions than Hillary in Michigan, and only 1.31 times more <$200 contributions in Indiana.

Thanks for the interest everyone, and happy voting to all you Hoosiers!

-Tyler

As you all know, I’m just a poor graduate student. If you would like to support my work and want me to be able to afford Top Ramen (or maybe even pizza if you all are extraordinarily generous) while I’m working on these statistics, please click this link to donate to Tyler’s Food & Rent Fund!

(edit: Also, if you are an employer in the DC area and have an open position, I need a summer job! Please contact me if you think I would be a good fit for your organization. Paid positions only, please.)

APRIL DEMOCRATIC PRIMARIES: OUTLOOK

Hello everyone. I’ve been receiving a lot of requests to publish some early numbers for the April states, so I’ve put some preliminary numbers together for you.

I will continue updating this post as new data comes in.

Here are the current projections:

Screen Shot 2016-03-30 at 7.56.02 PM

Producing the following delegate allocation:

Screen Shot 2016-03-30 at 7.55.26 PM

  • Wisconsin: Bernie should do well here, though I’m not sure that he will do as well as the above numbers indicate. He has a significant presence on social media, and the demographics favor him. Wisconsin is an open primary, however, and the crossover anti-Trump votes by Democrats or Independents that would have otherwise supported him will be damaging. This effect is accounted for in the above numbers, though.
  • Wyoming: Bernie will win Wyoming by a margin somewhere between 25-60 points. Wyoming is a caucus and is only 0.8% African American.
  • New York: Hillary will do very well here. She has a massive social media presence among New Yorkers, and the state has a slightly larger than average percentage of African Americans. New York also has a closed primary.
  • Connecticut: This state is a toss up at the moment. Sanders has a fair social media presence here, but Connecticut has a closed primary. He has lost every fully closed primary (not semi-closed) thus far.
  • Delaware: Hillary should win Delaware by 10-40 points. This is because of the closed primary format, as well as the 21.4% African American population.
  • Maryland: Hillary will, more than likely, win Maryland by the biggest margin of any of the April primaries. This is because of the 29.8% African American population (more than Alabama, and effectively the same as Louisiana) and the closed primary format.
  • Pennsylvania: Because it is still several weeks until Pennsylvania votes, I can still see this one going either way, though it is clearly leaning Hillary. Pennsylvania has a closed primary as well, though Bernie has a decent social media presence in the state.
  • Rhode Island: It will be a while before Rhode Islanders vote, but it is currently leaning Bernie. Rhode Island has a semi-closed primary, which Sanders has done relatively well in so far (New Hampshire, Massachusetts, Oklahoma, North Carolina) compared to closed primaries. Rhode Island is 5.7% African American, but Bernie has only an average social media presence in the state. I would classify Rhode Island as a toss up.

As you can see, even if Bernie does remarkably well in Wisconsin, Wyoming, and Rhode Island, the delegate deficit he will pick up in Maryland alone will more than cover those surpluses. Hopefully the Sanders campaign campaigns intensively in New York, Pennsylvania, and Maryland to try to control the damage. Bernie’s campaign may, in fact, be mathematically better off forgetting Wyoming and Rhode Island altogether if (for example) a couple of points of over-performance in New York means that he offsets twenty delegates worth of deficit he would have otherwise incurred; though outright wins are without a doubt important.

As always, thank you everyone for the interest. I am truly honored that so many people enjoy and look forward to my work.

-Tyler

DEMOCRATIC PRIMARY PROJECTIONS: ALASKA, HAWAII, WASHINGTON

Let me first address the elephant in the room.

Arizona was a catastrophe. Thankfully, the controversy has picked up enough media attention that many of you already know what happened. For those of you that don’t, this article touches on some of the issues, though I don’t agree with everything that he says.  I have been aware of several instances of election fraud (though these were through manipulation of votes on electronic voting machines) in this election cycle already through the incredible work of this statistician named Beth Clarkson, but have largely remained silent on the issue because the instances thus far haven’t altered the results so much that the candidate that should’ve won lost. Not to mention, anyone that speaks out against perceived electoral injustices is immediately deemed a sore loser and totally discredited.

I encourage you to read through Beth’s work. She has received a great deal of media attention over the past couple of years and is actively working to improve the electoral process. I know many of you will disagree, but I stand by my Arizona projection and believe that if the election had been conducted in a normal, reasonable way, Hillary would’ve lost or came very close to losing. I have honestly lost a lot of sleep over this, and I can only hope that none of us witness anything like that again. Like many of you, I just want a fair election.

Now, for the elections today. Here are the numbers:

Screen Shot 2016-03-26 at 12.48.37 AM

Bernie Sanders should win Alaska, Hawaii, and Washington, largely for three reasons:

  • Extremely low populations of African Americans, 1.6-3.6%, among the nations lowest
  • All three are caucuses
  • Hillary Clinton has an unusually low proportion of Facebook likes in all three states, 17-19%, which is among her worst

With all this being said, there is once again the question of how a particular ethnic group will vote, but this time it is with respect to Hawaii. Hawaii has a large population of Asians, native Hawaiians, and Pacific Islanders, unlike any state we have seen thus far. These groups could be predisposed to favor Hillary Clinton, but the null hypothesis that I must currently accept is that they aren’t. I have tested the effect of Asian population size  on previous results specifically for the sake of Hawaii after a friend suggested that I do, but it was very statistically insignificant, with a p-value of ~0.8 and actually a positive coefficient for Bernie vote share at that. Regardless, Hillary Clinton won the Northern Mariana Islands as well as American Samoa, so perhaps it is the case that in locales with Asian majorities, the dynamic changes. Hawaii is a politically unique state in many other ways, so it will be interesting to see if this estimate holds true.

Also, I want to sincerely thank everyone for the outpouring of support. I received countless emails and messages after Tuesday’s elections, even immediately after the initial Arizona results made me look like a complete moron. To all of you that I haven’t yet been able to respond to personally, I apologize for the delay but I will get to you!. I have no agenda, and I’m not doing anything remarkable, though I’m flattered by those that suggest as much. I just want to perform solid regression analysis and statistical work to give you all the most accurate electoral projections (without using polls!).

-Tyler


FINAL DEMOCRATIC PRIMARY PROJECTIONS: ARIZONA, IDAHO, UTAH

Sanders search interest has fallen dramatically in Arizona over the past two days, and it remains to be seen if this will have a significant impact on the results tonight, but this same rapid downward search trend happened in Minnesota and did not ultimately change anything. Meanwhile, search interest for Bernie in Idaho and Utah is through the roof. Here are my final estimates for tonight:

Screen Shot 2016-03-22 at 12.03.04 PM
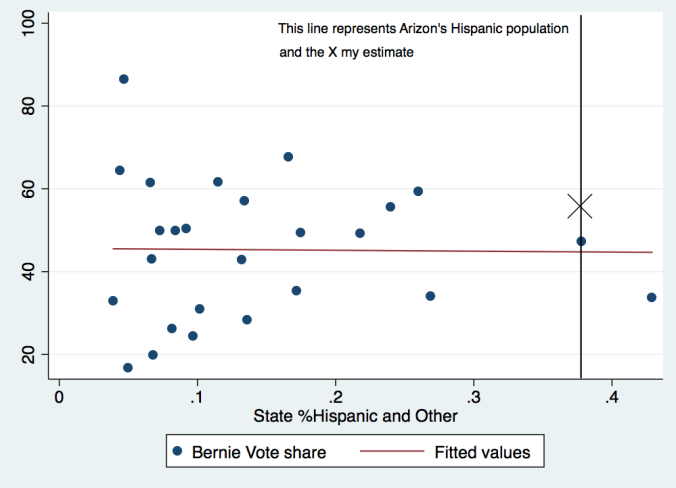
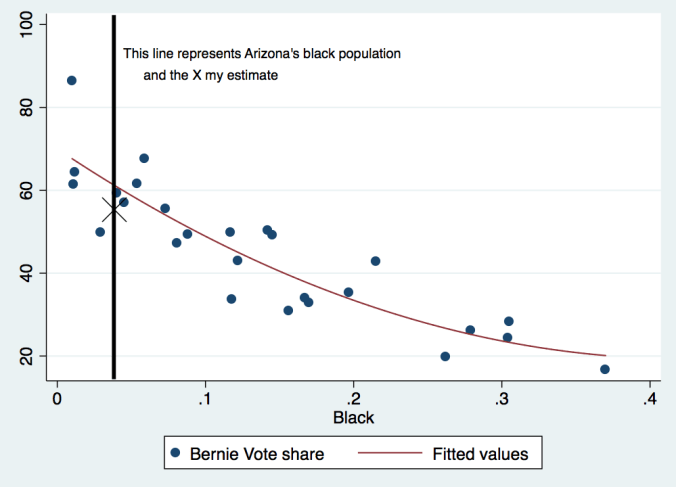
Hillary’s greatest advantage at this time is likely all of the early ballots that have been cast in Arizona. Other states have shown us that residents who are proactive enough to cast early ballots seem to vote disproportionately for Hillary Clinton (older people, of course). Who knows if this trend will hold true in Arizona, though I imagine it will.

Here are some charts to demonstrate a few relationships between variables.

In all charts, the Y-axis is the %Vote Share of Bernie Sanders.


Screen Shot 2016-03-22 at 12.17.00 PM

The chart looking at Facebook like proportions should demonstrate that Bernie’s current “polling average” of ~23% in Arizona is not reflective of reality. Bernie almost has to land somewhere between 45% and 63% because this is such a strongly correlated variable.

Screen Shot 2016-03-22 at 12.14.28 PM

Hopefully this convinces at least a few people that what I am proposing with Arizona is not in any way a radical idea.  As you can infer from this chart, in general, Hispanics don’t tend to vote for Hillary or Bernie in America. There is actually almost perfectly no correlation.

Screen Shot 2016-03-22 at 12.11.13 PM

As for the %Black variable, and as you can see in that chart, I am actually estimating Bernie to under perform with regard to it. Bernie almost has to land somewhere between a 48% to 75% interval because this variable is also so strongly correlated with vote share.

Thanks for all of the interest,

Tyler

WHAT HAPPENED LAST TUESDAY?

Though I seek to be accurate with margins of victory and loss with the projections I post here, even more important than that are the predictions of whether a candidate will win or lose a contest. As many of you already know, I got two consequential calls wrong last Tuesday, and missed two more by significant amounts. Hillary Clinton won Missouri by 0.2%, and won Illinois by 1.6%; both very small margins. Though numerically I missed the win/loss in these states by 0.2% and 1.6%, I fully recognize that the difference is night and day. This is why I started over, from scratch, and have spent the last two days building a more robust and comprehensive model that can account for factors that I had previously thought were indirectly contained within the variables I was using.

  • Why did Bernie under-perform my estimates in almost every state Tuesday? Was it coincidence or a systemic mathematical bias of my model?

I believe it was more coincidence than mathematical bias, though I will concede both to some degree. I do want to make it clear that there was no intentional bias (I have been accused numerous times of inflating Bernie’s numbers for some imaginary reason), but rather the structure of the model itself created a mathematical bias in four of these last five elections. I say it was coincidental because the factors that allow this bias to show appeared disproportionately in most of Tuesday’s states, particularly states with an open primary.

Illinois, Missouri, and Ohio all have open primaries. Up until this point, the open primary was not a statistically significant driver of results for either candidate, and therefore was not included in my model. However, over this past month, more and more Democrats (apparently a disproportionate number of Sanders rather than Clinton supporters) have been requesting Republican ballots in open primaries to cast anti-Trump votes. They seem to harbor more disdain for Donald Trump than support for Bernie Sanders. I was able to isolate this effect and subsequently include it in the new model by interacting the amount of Trump support on social media in a state with a binary variable that defines whether the state has an open primary or not. This is a powerful variable, because it accounts for the scale of anti-Trump sentiment. In states that have more Trump support, more Democrats will cast anti-Trump votes, disproportionately helping Hillary Clinton. This happened to a substantial extent in Illinois, Missouri, and Ohio.

I am also now factoring in the median age of the state in question. Though Sanders has won some “older” states like Maine, New Hampshire, and Vermont, he does better overall in “younger” states, statistically speaking. Florida and Ohio are both older states, with a median age of 41.6 and 39.4, respectively. This is now being accounted for and will help produce more accurate results.

I have heard the claim many times that northerners and southerners, and particularly minorities, just vote differently from an ideological perspective. I don’t disagree, but I had previously believed that this bias was contained in the social media data that I was using. I have been experimenting with including a variable to track whether a state is in the “Deep South,” and as it turns out, this variable is statistically significant. In my opinion, this is the primary reason that Hillary Clinton performed so much better than my expectations in Florida. Even accounting for so many different things, people that reside in an area that possesses a southern culture will simply vote for a more conservative candidate.

I am happy for the opportunity to refine the model in so many different ways. This is, at its very core, an experiment to determine whether it is possible to model primary elections without the aid of public polling. I have a renewed confidence in the projections for the next few weeks, and look forward to determining once and for all which candidate Hispanics prefer with the Arizona contest next week.

-Tyler


MICHIGAN, MISSISSIPPI DEMOCRATIC PRIMARY PROJECTIONS

It’s a bit unsettling to go against the grain with this forecast. As far as I know, every outlet is projecting a Clinton win tomorrow in both Michigan and Mississippi.

The Sanders campaign must be doing something remarkable in Michigan right now, because the upswing in Sanders popularity among my data sources is undeniable. I am seeing levels of interest in Bernie Sanders in Michigan similar to that of Colorado, Oklahoma, Kansas, and Nebraska. This, along with Michigan’s relatively normal demographic makeup, leads me to personally believe that he does have a chance. It leads my model to estimate that he will win there. Hillary leads every conventional poll, however, which makes me skeptical of these numbers.

Bernie Sanders will be lucky to get above 20% in Mississippi, but I do believe that if he doesn’t win Michigan, the final results will be very close. Here are the numbers:

Screen Shot 2016-03-07 at 11.35.52 PM

My official prediction is that Bernie will win Michigan and Hillary will win Mississippi, but in reality Michigan is too close to call with a mathematical model. Elections culminate in a single number after the movement of hundreds or thousands of variables, and as statisticians we can only select a few of those and hope that we account for as much variance as possible. Given the outcome of all the other elections so far this season, the positions of those variables right now in Michigan seem to indicate that a massive upset will happen tomorrow night.

-Tyler

SUPER TUESDAY DEMOCRATIC PRIMARY AND CAUCUS PROJECTIONS: REVISED

It has become clear that the social media data that I used in my previous forecast became antiquated quite quickly, due to the relatively large margin between the South Carolina estimate and actual result.

Thanks to a good friend’s tip, I began to utilize data from Google Trends to develop new estimates for Super Tuesday. Looking in retrospect, the correlation between the Google data and results in the first four states is striking once one has massaged the data set to produce usable measures (I use relative search frequency averaged over the couple days prior to the election). Demographics are taken into account as well. The new estimates are as follows:

Screen Shot 2016-03-01 at 12.22.32 AM

This produces an estimated delegate allocation as follows (super-delegates are not included in this table):

Screen Shot 2016-03-01 at 12.27.15 AM

Once we have the data from Super Tuesday, we will all be able to hone the accuracy of our models even further.

-Tyler

2016 DEMOCRATIC PRIMARY PREDICTIONS

I have recently been developing a statistical model for the sake of predicting the electoral outcomes of the Democratic primaries. I have used the first three primaries, Iowa, New Hampshire, and Nevada, to gather the relevant data for the model. This model is experimental in the sense that I am using data that has been aggregated from social media to make my estimates. To my knowledge this has never been done before, but after this election season we will be able to determine the viability of social media political sentiment as a proxy for broader public political sentiment.

There are many elements and controls to any good statistical model, and at this point there is not enough variance in some of the variables that I would like to include; nor is there enough observations to truly call anything statistically significant. However, the model will continue to get more and more accurate as the primary season progresses. Regardless, I am very confident in the predicted Super Tuesday (and beyond) outcomes at this point. Here are the estimates:

Screen Shot 2016-02-23 at 3.05.05 PM

Massachusetts and Oklahoma are italicized and bold because I have determined they are too close to call. By slightly changing one of the underlying assumptions in my model, a different winner results. I do believe that Bernie will win Massachusetts and Hillary will win Oklahoma, but that is really no more than conjecture. I hope you all find this interesting. For anyone with a background in statistics and/or econometrics that would like to know more about the fundamentals of my model, just shoot me an email and I would be happy to discuss it with you.

-Tyler