My new website for a quick-look on the U.S. Treasury Yield Curve

Hello everyone,

I apologize for my extended absence. It turns out that I don’t write many essays that aren’t for work now that I’m no longer in graduate school; who would’ve thought?

I have in fact been working on a project as of late, however. The problem that I sought to address was the lack of any good yield curve visualizer for U.S. Treasury bonds. You can always go to the Treasury’s website and look at the latest interest rates, yes, but that’s not a great solution for people that feel they could better understand where the economy and business cycle are at with a visualization of the yield curve as opposed to just parsing the raw data. I’m one of those people.

So, I bought the domain www.yieldcurvenow.com and began learning JavaScript.

Screen Shot 2018-07-25 at 11.12.50 AM

I want this website to be a no-nonsense, lightning fast resource for those that need to know which way the yield curve is moving on a day-to-day basis. Not only this, I’ll be taking some time to write extensively on www.yieldcurvenow.com to help people understand what a yield curve is, why its shape matters, and the various factors that influence the movements of interest rates.

As always, please let me know if you have any feedback, it would be much appreciated!

-Tyler

THE ELUSIVE ELECTRON: ELECTRICITY THEFT AND GOVERNMENT FAILURE IN HAITI

Haiti has the lowest coverage of electricity in the Western Hemisphere, with only 37.9% of the population having regular access.[i] The energy sector in Haiti is broken by any modern standard, with frequent interruptions in service making it impossible to rely on the public utility to provide enough power to even maintain a freezer to preserve food. Something relatively unique to Haiti, however, is the rampant theft of electricity, with half of all residents being connected to the grid illegally; a problem that a public utility rarely has to contend with.[ii]

It is concluded that these problems stem from a failure of the government of Haiti: a complete lack of the institutional capacity needed to provide a public utility to the country. This problem results in much of the population, including hospitals and other major institutions, relying on generators which are highly inefficient, negatively affect the environment, and make the country as a whole more susceptible to volatile oil prices. Moreover, a decrepit electricity generation and distribution network creates the conditions that allow for 54% of the electricity that is distributed to be stolen or lost, while the world average is only 8%.[iii]

ANALYSIS

INSTITUTIONAL WEAKNESS

            Not only contained within the energy sector, the Haitian government can be characterized by an astonishing lack of institutional capacity. This is largely because Haitian politics have historically been so unstable, with coups being a regular occurrence and widespread corruption being an accepted part of every day life. Dictators have regularly stolen millions of dollars from the Haitian treasury, straining the Haitian fiscal situation even more than it already is. Thus, one can see that government failure in the energy sector is not unique in the context of the broader governmental apparatus. Insofar as this is true, the shortcomings of Haiti’s past have largely shaped the present, and Haiti is still playing catch-up to the rest of the world. Institutional weakness as it pertains to the energy sector is as follows:

  • Loss of technical know-how: In 2005, the Secretary for Energy, Mines, and Telecommunications (SEEMT) was eliminated, with the Ministry of Public Works, Transport, and Communications (MTPTC), as well as the Bureau of Mines and Energy (BME) supposedly taking its place. The SEEMT was previously tasked with the creation of energy policy, enhancing the electrical grid, and maintaining current systems, thus, the SEEMT worked in a policy and technical capacity. Because there was no effort on the part of the Haitian government to integrate some of the human capital possessed within the SEEMT with the institutions that were assuming its responsibilities, a great deal of technical know-how was lost in the transition.[iv] The has led to a total and complete failure of the MTPTC to manage and maintain electrical infrastructure, much less advance and improve it.
  • Diffusion of responsibilities: There is no institution or agency tasked with regulating the energy sector in Haiti, ironically creating a problem that government, by its very definition, is supposed to solve. In theory, the MTPTC and BME both work with the state-owned electric utility Electricité d’Haïti (EDH) to advance national energy policy, but progress has been excruciatingly slow due to the fragmentation of responsibility. MTPTC, BME, and EDH have been working on a national energy policy since 2006, releasing a draft in 2012, but have not yet implemented any of it.[v]


RELIANCE ON TIMBER

Because the Haitian economy is so under-developed, with a GDP (PPP) per capita of only $1,800, real GDP growth rates of less than 2%, an unemployment rate of over 40%, and a fiscal budget deficit, nearly everyone in Haiti uses wood or charcoal for lighting and cooking. Those that are well off will instead use diesel generators as they cannot rely on a constant source of electricity from EDH.[vi]

  • Public health: 77% of energy usage in Haiti comes from the use of wood and charcoal for primary energy use, while accounting for 93% of the fuel used for household cooking.[vii] Like many other developing nations that use similar fuels, this has serious public health implications, as these fuels are often used indoors and emit harmful respirable toxins.
  • Environmental impact: The reliance on wood and charcoal fuels has resulted in a tremendous demand for timber in Haiti. Due to the relative size of the population to the country’s land area, this demand has caused complete deforestation of the entire country. Deforestation at this scale also creates a cascade of other problems, e.g. the displacement of topsoil from higher elevations to waterways which reduces agricultural output and has been documented to reduce certain river flows (and thereby impacting drinking water sources) by 80%.[viii] This is an unsustainable practice, and at this point, it will take decades to restore the environmental damage that has already been inflicted on the Haitian landscape.


THEFT OF ELECTRICITY

            Lastly, perhaps Haiti’s most obviously apparent problem in the energy sector is the widespread theft of electricity, with an estimated 54% of all electricity produced being stolen or lost in transmission. The root causes that create the conditions for rampant theft are EDH’s inability to bill and collect payments, an unregulated electrical infrastructure that has been cobbled together and not maintained, and a lack of commercial customers that shifts the revenue burden to those that are poorest.

  • Billing and collections: EDH, consistently suffering from the institutional capacity problems that also afflict the wider Haitian government, has shown a consistent inability to implement efficient billing and collection practices. Underscoring inefficient bureaucratic procedures are a lack of electricity meters that would otherwise determine how much to bill each customer. A recent USAID project installed proper connections and meters to over 8,000 households, and found that collection rates improved from 25% to above 90%.[ix] A central principle to collecting payment is first ensuring that the customer and utility can agree on the level of service consumption.
  • Poor infrastructure: The electrical infrastructure of Haiti is severely under-maintained. This is most easily attributed to a lack of financial resources, a lack of technical know-how, and a complete lack of regulation of the infrastructure itself. Because the energy grid is so frequently down (with most customers only receiving around ten hours of electricity per day[x]), this provides ample time for individuals to make illegal connections to distribution systems, as a majority of the time there is no associated danger. Moreover, a dilapidated grid that provides such poor service has the effect of creating a culture of non-payment, as consumers don’t feel like they are receiving a quality of service that would justify compensation.
  • Inflated prices: As previously mentioned, because businesses and organizations cannot rely on EDH to provide electricity around-the-clock, these organizations turn to diesel generators for their energy needs. The effect that this has on the economics of the public utility are far more impactful than one may initially assume. These firms are the would-be customers that would be best positioned to actually pay for the electricity service, but in their absence, the burden to pay falls on those with the least amount of resources. This means that the final cost of electricity is shaped by a customer base in which many aren’t paying, incentivizing EDH to raise their prices in an attempt to recoup the lost revenue from customers that are In sum, this artificially increases electricity prices, leading to a situation where electricity costs as much as $0.34/kWh in Haiti; far more than nearly every other country on Earth, and about triple the costs that one would encounter in the contiguous United States.[xi] This further incentivizes theft of electricity.


CONCLUSION

It is well documented that widespread, reliable access to electricity is a key for economic growth, thus, if the nation of Haiti ever wishes to become a legitimate player in the global economy, it must first solve this fundamental problem of electricity generation, distribution, and access. It is concluded here that the government of Haiti has failed in its totality for decades to build the institutional capacity needed in order to accomplish these goals, and the spillover effects include but are not limited to a failure to produce any national energy policy or decide who is to regulate the sector, widespread reliance on charcoal and generators for cooking and lighting that have detrimental public health implications, deforestation of the entire country, artificially and insurmountably high electricity prices for consumers, an exacerbated fiscal deficit due to EDH subsidies to recoup lost revenue, and the extremely prevalent theft of electricity. These findings show that, despite the efforts of numerous countries to aid the people of Haiti in ways that increase the resilience and efficiency of their electrical grid, the ultimate responsibility to advance the cause of the Haitian people falls squarely on their own government.


ENDNOTES

[i]    The World Bank. Access to electricity (% of population). 2012. 1 March 2017.

<http://data.worldbank.org/indicator/EG.ELC.ACCS.ZS&gt;.

[ii]   USAID. Haiti Energy Fact Sheet – January 2016. Fact Sheet. Washington: USAID, 2016.

[iii]  The World Bank. World Development Indicators: Power and Communications. 2014. 27

February 2017. <http://wdi.worldbank.org/table/5.11&gt;.

[iv]   The World Bank. Project Information Document: Haiti Electricity Loss Reduction Project.

Report. Washington: The World Bank, 2006.

[v]   Energy Transition Initiative. Energy Snapshot: Haiti. Report. U.S. Department of Energy. Washington: U.S. Department of Energy, 2015.

[vi]   U.S. Central Intelligence Agency. The World Factbook: Haiti. 2017. 2 March 2017.

<https://www.cia.gov/library/publications/the-world-factbook/geos/ha.html&gt;.

[vii]   Worldwatch Institute. Haiti Sustainable Energy Roadmap. Report. Washington: Worldwatch

Institute, 2014.

[viii]   McClintock, Nathan. Agroforestry and Sustainable Resource Conservation in Haiti. Case

Study. North Carolina State University. Raleigh: NC State, 2004.

[ix]   USAID. Haiti Energy Fact Sheet – January 2016.

[x]   Worldwatch Institute. Haiti Sustainable Energy Roadmap.

[xi]   Friedman, Lisa. Can Haiti Chart a Better Energy Future? 17 April 2013. 3 March 2017.

<https://www.scientificamerican.com/article/can-haiti-chart-a-better-energy-future/&gt;.


DIRECTIONAL DRILLING: A PARADIGM SHIFT IN ENERGY EXPLORATION AND RECOVERY

The history of petroleum production since the nineteenth century is largely characterized by the technology that was used to extract it from the Earth. Throughout this history, there have been many paradigm shifts in which a new technological regime dramatically improved the efficiency of petroleum extraction, transport, refining, and use. One of the most recent of these paradigm shifts is the development of rotary steerable systems (RSS), which allow drilling operators to control the direction of the drill bit while the drill is still in operation, hence, while the drill is under load and underground. Though the task seems rudimentary, the technology required to achieve this degree of remote control is incredibly complex – among some of the most advanced technology that mankind has developed – including a highly sophisticated system of electronics that must operate reliably miles underground in some of the harshest conditions imaginable. These developments have been a critical component of the shale revolution, and is one of the only reasons that the modern fracking industry exists. We will explore what advances made these systems possible, and why a task as simple as drilling sideways isn’t as easy as it seems.


EARLY DEVELOPMENTS IN DIRECTIONAL DRILLING

            The first engine-drilled commercial oil wells were established in the 1850s and 1860s in Canada and the United States, but it took many decades before producers became conscious of the utility of drilling wells at an angle that was not necessarily vertical.[i] The first widely known instance of a drilling rig intentionally drilling at an angle to achieve a specific objective occurred in 1934, when John Eastman and Roman Hines were able to drill slanted relief wells into an oilfield to reduce the pressure; an instrumental feat in reining in a well which had blown out. Eastman and Hines were featured in an issue Popular Science in May of that same year, where the magazine details Eastman’s primitive but effective surveying tool, “Into the hole went a single-shot surveying instrument of Eastman’s own inventions. As it hit bottom, a miniature camera within the instrument clicked, photographing the position of compass needle and a spirit-level bubble.” [ii] Indeed, the ability to “survey” and track the location, inclination (the difference in well angle from vertical), and azimuth (the compass direction) of the drill head is just as critical as having the hardware to drill in a given direction. Because micro-electronics had not yet been invented, early efforts relied on northing more than crude instrumentation such as Eastman’s camera.

The first piece of technology that truly laid the foundation for directional drilling was the development of what is today known as a “mud motor,” which is a type of progressive cavity positive displacement pump (PCPD) that is generally located immediately behind the drill bit in the drill string. Obviously the mud motors of today look vastly different from early versions, but they can trace their lineage all the way back to two patents, the first of which is entitled Drills for Boring Artesian Wells, filed by C. G. Cross in 1873, and the second of which is entitled Machine for Operating Drills, filed by M. C. and C. E. Baker in 1884.

patent

The first piece of technology enabling some measure of directional drilling

Source: Cross, C. G. Drills for Boring Artesian Wells. United States of America,

Patent 142992. 23 September 1873.

The issue that both of these designs were attempting to address was the collapse or breakage of the drill string in rotary and reciprocating drilling operations, respectively. Because early steel was of such poor quality, rotating the entire drill string assembly from top to bottom induced these problems. Shallow wells could be drilled without issue, but the torsional stresses on the drill string only increased as the well got deeper due to the increasing mass of the string and the torsional flex that was inherent to the pipe or rods being used. Both Cross and the Bakers developed mechanisms in which the drill string could remain stationary while the drill bit turned, by pressurizing the drill string with fluids such as water, steam, or air, then using this pressure to drive a very rudimentary motor, i.e. the drill bit.[iii] [iv] By solving this problem, drill operators naturally discovered that they could use a section of slightly curved pipe in the drill string to influence the direction the drill, so long as the string remained stationary while the bit turned. They could install one length of curved pipe, lower the assembly to the “kickoff point” (the point in which a well begins to deviate from vertical), drill until they had reached their desired change in well inclination and/or azimuth, then raise the assembly and swap the curved pipe back to straight.

As earlier mentioned, the ability to track the location of the drill head is of the utmost importance in trying to steer a drill into a pocket of oil or gas. Early efforts in “measurement while drilling” (MWD) consisted of little more than pendulums to determine the inclination of the well, and compasses to determine the azimuth. However, pendulums were ineffective for deeper wells, and compasses often had issues when used inside of well casing as the steel interfered with the Earth’s magnetic field. This ushered in the era of micro-gyroscopes in the early 20th century, which are still used to this day.


THE TECHNOLOGY

            The difference between RSS and conventional systems begins at the kick-off point in the well. The systems used to steer the bit vary significantly among manufacturers, but there are two primary platforms that all manufacturers have built their systems upon: “push-the-bit” and “point-the-bit” designs. Push-the-bit systems rely on a small array of pads around the circumference of a sleeve located just behind the bit. This system uses internal hydraulic pressure to selectively actuate the pads outward to push against the side wall of the well; applying pressure to one side causes the bit to curve in the direction opposite of the pad(s) being utilized. By doing this, the tool is able to influence the direction of the bit, steering it while in operation.

pushthebit

A “push-the-bit” system. The pads are actuated in order to “push” the bit in the opposite direction.

Point-the-bit systems work in a very different manner. Their ability to steer the bit is achieved by using a variety of components to push on the drive shaft, creating a deflection in the bit by way of a fulcrum between the control unit and the bit. Companies have developed very unique and clever ways to create this bit deflection. For example, the company Weatherford uses a radial array of sixty-six electronically triggered and hydraulically actuated pistons to flex the shaft in the desired direction.[v] Halliburton uses a pair of nested eccentric rings through which the drive shaft turns. These rings are independently rotated to create the desired bit deflection.[vi]

weatherford

Weatherford’s “point-the-bit” RSS

halliburton

Halliburton’s “point-the-bit” RSS


Common to both of these systems is the need to have the control unit remain stationary or “upright,” whether the drill string is rotating or not, else, it would be impossible for the control systems to have any frame of reference from which to command the direction of travel. Many systems use blade-like devices mounted radially on the outside of the control unit, much like the aforementioned pads in push-the-bit systems, also akin to the fletching of an arrow. These devices, coupled with high-performance bearings on both the front and the rear of the control unit, create enough friction between themselves and the sidewalls of the well to prevent rotation of the tool. This is essential to maintain full control of the well’s direction.

Measurement while drilling methods have also advanced substantially from the early days of directional drilling. No longer is it necessary to use pendulums or down-hole cameras to determine the progression of the well. The first major advancement came with the development of what is called “mud pulse telemetry,” which is not in and of itself a tool to pinpoint the location of the drill head, but instead a method of data transmission. Because these drills, and by extension the entire drill string, are continuously pressurized with drilling fluid also known as “mud,” a clever innovator discovered that one could take this baseline pressure and modulate it over time. To create this variance in pressure, a system of electronics rapidly actuates a valve on the drilling platform to send data to the drill underground, and actuate a valve in the drill to send data back to the platform. These variances in mud pressure are essentially encoding the drilling fluid with information about the location, depth, inclination, and azimuth of the drill. Pressure differences are received as analog signals (which are then modulated into digital data) in real time by both a device coupled to the drill string on the rig, as well as a device within the control unit adjacent to the drilling head underground. Mud pulse telemetry is the most commonly used method of data transmission in drilling operations, as it is highly reliable and usually fast enough for most wells. Though current technology can reach bandwidth speeds of up to 40 bits/s, significant signal attenuation occurs with more depth, and these systems often transmit data at speeds far less than 10 bits/s. For highly irregular wells at great depth, low bandwidth can create a serious amount of downtime for the rig while crews wait for information to be exchanged, thus other methods may be employed.[vii]

Electromagnetic (EM) telemetry has emerged more recently as a system far superior to mud pulse telemetry in certain situations. EM systems utilize a voltage difference between the drill string and a ground rod driven into the Earth some distance away from the well. Though this system can transmit data much faster than mud pulse telemetry for shallow wells and wells that are drilled using air as opposed to a liquid, the electromagnetic signal attenuates very rapidly with well depth. Within the last decade, some companies have also developed drilling pipe that incorporates a wire into the pipe wall. This wire is connected from stick to stick of pipe, and can offer data transfer speeds orders of magnitude faster than either of the previously mentioned methods; over 1,000,000 bits/s. Using a system like this requires drill operators to be much more attentive to the process of building the drill string, ensuring that each connection is resilient enough to withstand the harsh environment it will operate in down-hole. This is the future of MWD, but until this technology becomes common among drillers, manufacturers of these components will be unable to realize the economies of scale that come with mass production, and that ultimately make these components cheaper and more reliable to use.[viii]

This collection of technologies has enabled drilling operators to reach distances that their predecessors likely couldn’t even comprehend. It is not uncommon for a horizontal drilling operation to achieve lateral distances of over one mile, though some operations have done much more. In 2016, Halliburton and Eclipse Resources drilled the longest horizontal well in the U.S., exceeding 18,500 feet drilled horizontally.[ix] This still doesn’t come close to beating the record set by Maersk Oil in 2008, when they completed an offshore well in Qatar that had a horizontal section of 35,750 feet in length. Highlighting the precision of this technology, all seven miles of this Qatari well were drilled through a reservoir target only twenty feet in thickness under the sea floor.[x]


BENEFITS AND ROLE IN THE SHALE REVOLUTION

It is only with highly advanced rotary steerable systems and measurement while drilling methods that operators are able to achieve these feats of nature. Directional drilling offers several fundamental advantages over conventional drilling techniques, the first and perhaps most obvious of which is the ability to drill more wells from the same platform or rig. Whereas in the past drillers had to construct many wellheads in close proximity to each other to increase the rate of resource extraction from a single reservoir, directional drilling allows operators to use a single wellhead to access dozens of different wells. This has had a monumental effect on increasing the efficiency of resource recovery operations, introducing an economies of scale into the process that dramatically reduces the cost of infrastructure and reduces the amount of time labor spends shifting from location to location. This has the effect of permanently increasing the productivity of assets under management by several fold.

Directional drilling also eliminates topographical constraints with respect to where the drilling rig and wellhead are located. This means that drillers are no longer forced to haul materials off-road, over mountains, or through rivers to locate the rig above a prospective reservoir. Far fewer roads and bridges have to be constructed to make the rig regularly accessible. One can imagine a multitude of circumstances in which it could be immensely troublesome to clear forests, fill in streams, or level the side of a mountain just to create a good working surface for drillers, but with these systems, drillers can locate the wellhead wherever it is easiest. In this way, this method of resource extraction drastically reduces the amount of environmental destruction that occurs in this industry. Additionally, resources located under small bodies of water can be extracted from shore, and resources located under cities or populated areas can be safely extracted from a safe distance.

In comparison to the directional drilling technology of the mid twentieth century, rotary steerable systems eliminate the downtime drillers were previously subjected to when they had only curved pieces of pipe to use in order to influence the well direction. Drillers pulled the entire drill string out of the well to insert a single piece of curved pipe in order to drill a dog-leg angle, but would then have to pull the drill string out again to convert the drill back to its previous state to continue in a straight line once they had reached the desired inclination and/or azimuth. Disassembling the drill string is a time-consuming process, thus, being able to control the drill while in operation eliminated all of this downtime, shaving days or weeks off of the project. This further reduces operational costs to the company, and by extension, oil and gasoline prices to consumers.

Directional drilling has also been a critical component to the growth in market share of shale oil and gas, and had this technology not been developed, the shale revolution would have not been possible. Conventional fossil fuel resources have historically been extracted from homogeneous formations whereby companies only needed to pierce the formation and let the immense pressure deliver the resource to the surface. With respect to shale-derived gas, horizontal drilling is necessary as the resource exists trapped within a non-fluid substrate; thus, one must impart a destructive force on the substrate itself to allow the resource to flow. This means that the development of a well requires drillers to have a presence in as much of the formation as possible to maximize the total volumetric space that they can fracture. Due to way in which fossil fuels were formed, reservoirs are typically very thin relative to the overall area that they occupy, which means that drillers must be able to steer their tools horizontally so as to maximize the surface area of the well that is in contact with the resource. In practice, this means that gas extraction from shale involves a great deal more horizontal drilling than vertical. Moreover, individual shale formations can rise and fall with the topography of the landscape they exist under, necessitating precision guidance of the drill to stay within the confines of the formation. In short, extracting shale resources would not be economically feasible without directional drilling.

CONCLUSION

As one can see, modern directional drilling and RSS technology required nearly two centuries of incremental innovation to make the technology what it is today. In many ways, this technology is a testament to the persistence of mankind to improve the efficiency of business operations, never relenting in their pursuit to reduce costs and maximize profits. Innovators will stop at nothing to create new ways to more efficiently extract, transport, refine, and use our natural resources, making the resulting commodities cheaper and more accessible to the disadvantaged communities of the world. Directional drilling has unlocked reservoirs of fossil fuels that only a decade ago were thought to be far too costly to extract, but this calculus has undergone a complete transformation given the advanced systems available today. Given how formative rotary steerable systems were for the past two decades of oil and gas extraction, one can only imagine what is in store for the industry in the future.


ENDNOTES

[i] Oil Museum of Canada. Oil Springs. 21 November 2015. 10 February 2017. <http://www.lclmg.org/lclmg/Museums/OilMuseumofCanada/BlackGold2/OilHeritage/OilSprings/tabid/208/Default.aspx&gt;.

[ii] American Oil & Gas Historical Society. Technology and the Conroe Crater. 2017. 9 February  2017. <http://aoghs.org/technology/directional-drilling/&gt;.

[iii] Baker, M. C. and C. E. Baker. Machine for Operating Drills. United States of America: Patent 292888. 5 February 1884.

[iv] Cross, C. G. Drills for Boring Artesian Wells. United States of America: Patent 142992. 23 September 1873.

[v] Weatherford. Revolution High-Dogleg. 2017. 19 February 2017. <http://www.weatherford.com/en/products-services/drilling-formation-evaluation/drilling-services/rotary-steerable-systems/revolution-high-dogleg&gt;.

[vi] Halliburton. SOLAR Geo-Pilot XL Rotary Steerable System. 2017. 7 February 2017. <http://www.halliburton.com/en-US/ps/sperry/drilling/directional-drilling/rotary-steerables/solar-geo-pilot-xl-rotary-steerable-system.page&gt;.

[vii] Wassermann, Ingolf, et al. “Mud-pulse telemetry sees step-change improvement with oscillating shear valves.” Oil and Gas Journal 106.24 (2008)

[viii] National Oilwell Varco. IntelliServ. 2017. 11 February 2017. <http://www.nov.com/Segments/Wellbore_Technologies/IntelliServ/IntelliServ.aspx&gt;.

[ix] World Oil. Halliburton, Eclipse Resources complete longest lateral well in U.S. 31 May 2016. 8 February 2017. <http://www.worldoil.com/news/2016/5/31/halliburton-eclipse-resources-complete-longest-lateral-well-in-us&gt;.

[x] Gulf Times. Maersk drills longest well at Al Shaheen. 21 May 2008. 14 February 2017. <http://www.gulftimes.com/site/topics/article.asp?cu_no=2&item_no=219715&version=1&template_id=48&parent_id=28&gt;.


A GAME THEORETICAL APPROACH TO OBAMA’S SCOTUS NOMINATION

Obama nominated Merrick Garland to fill the vacant seat on the Supreme Court nearly five months ago. Garland is well liked by both conservatives and liberals, and could reasonably be considered the embodiment of non-partisanship and legal expertise. Garland was chosen for precisely this reason. Obama knew that any left-winger would never get a hearing by the Republican-led Senate, and that a moderate was the only chance he had to fill the seat before his second term expired. However, the Republicans have, nonetheless, continued to refuse to hold a hearing on the matter, and this is actually their best play at this point.

Merrick Garland is well-credentialed, and there is no objectively good reason for denying him an appointment to the court. To hold a hearing puts Garland in front of a microphone and exposes to the American people why he is such a good choice. To do that and then vote to reject him would unveil blatantly extreme partisanship. However, to hold a hearing and then vote to appoint him to the Court would show that Republicans had “caved to Obama,” and I think we all know that they don’t want that kind of press only a few months before the election. Thus, in the end, this is the reason I believe that not holding a vote is theoretically the Senate Republicans’ best possible play.

This strategy made more sense during the Republican primaries, while it was still unknown who the eventual nominee would be – i.e., would it be someone who has a chance to win the general election? But, now that Donald Trump has been crowned the nominee, it is highly likely that Hillary Clinton will win the presidency. So how will the Garland nomination unfold given this assumption?

  1. Hillary Clinton would have every incentive to nominate a highly liberal judge for the empty seat on the SCOTUS. If the Democrats take back the Senate, and I believe that they will, this becomes entirely feasible and will represent quite a large ideological shift within America’s highest court.
  2. If Hillary wins the general election, or if it begins to even appear as though she will win in the weeks leading up to November, current Senate Republicans have every incentive to hold a hearing and vote to put Garland on the Court so that Hillary is unable to nominate a more liberal candidate.
  3. If Hillary wins, or if it begins to even appear as though she will, Obama then has every incentive to rescind his nomination of Merrick Garland (before the Senate Republicans frantically try to vote him in) so that Hillary can shift the Court even further left.
  4. Rescinding Garland’s nomination is quite a cruel thing to do, and on its surface it feels like something that would adversely impact Obama; i.e. it’s “playing politics with the Court,” right? No, and Republicans will be unable to use this as an argument. This is because Obama can simply state that Senate Republicans were obviously uninterested in Garland’s candidacy, as they have had months to vote on him and never did, so in return, he withdrew the nomination. He would be “giving them what they wanted.”

This whole story is a perfect representation of the inability for Republicans to work with the Obama administration, the paralysis in Congress, and to be frank, it is quite disheartening to me personally. If Trump wins, who knows what will happen or who he will nominate. Regardless, I strongly believe that Garland will never make it on the Court no matter who wins in November.

-Tyler

DEMOCRATIC PRIMARY PROJECTIONS: CALIFORNIA, MONTANA, NEW JERSEY, NEW MEXICO, NORTH DAKOTA, SOUTH DAKOTA

If you don’t typically read my entire analysis, this is the time to read it all. There are many caveats to the below numbers.

Tuesday is effectively the last of the Democratic primaries for 2016 (with the exception of D.C.), and is indeed the last opportunity for the Sanders campaign to close the pledged delegate gap. As we all know, all eyes are on the state of California, which is set to allocate 475 delegates between the two candidates. Bernie Sanders will need a massive majority of these 475 delegates (and, realistically, several large wins elsewhere too) to take the lead before the Democratic convention. Unfortunately for Bernie, my models are not suggesting that a pledged delegate lead is currently possible, despite four projected wins on Tuesday. However, it does look like California will be a very close race, and there is a very real possibility that Sanders could win there after all. Here are my projections:

Screen Shot 2016-06-05 at 8.38.52 PMIf you would like to support my work and want me to be able to afford Top Ramen (or maybe even Mellow Mushroom pizza if you all are extraordinarily generous) while I’m working on these statistics, please click this link to donate to Tyler’s Food & Rent Fund!

CALIFORNIA

Bernie Sanders should do better in California than is currently expected. Though I do believe that the state is leaning towards a Hillary win, there are several reasons why it should be a close race:

  • Sanders has 74.0% of Democrat Facebook likes in California. This is similar to Kentucky (73.9%), Oklahoma (75%), and West Virginia (75%). Hillary lost OK and WV, and won KY by 0.4% of the vote.
  • California is a semi-closed primary, which Sanders has usually done quite well in. Other semi-closed primaries that Sanders won are New Hampshire, Oklahoma, Rhode Island, and West Virginia. Semi-closed primaries that Clinton has won are Massachusetts and North Carolina.
  • Demographically, California is fair for both candidates. It is indeed a diverse state, but not necessarily to Sanders’ detriment. California has an African American population less than the country average, though it has a significant Hispanic population. Hispanics do tend to prefer Hillary, though my finding is that this effect is not very substantial. More on this effect in New Mexico below.
  • Of the twenty-one states that Sanders had a greater proportion of the relative number of campaign contributions, he has lost only five (IA, MA, NC, AZ, KY). Furthermore, he has won four states in which he had a lower number of relative campaign contributions than he has in California (CO, OK, NE, RI).

However, California typically has a large amount of early voting, which has historically been very beneficial to Hillary Clinton. I am admittedly unsure of the exact percentage of Californian likely voters that have chosen to already vote by mail, but it is my personal belief that this number will be around 40-45% after all of the vote comes in. I expect Bernie to capture only about 40% the early vote while Hillary secures 60%, but at the same time I am expecting Bernie to win about 57% of the day-of vote while Hillary trails with about 43% on Tuesday.

With all of that being said, I am very uncertain of what will happen in California. My personal feeling is that Bernie Sanders has a decent chance of winning, but gut feelings aren’t typically based on numbers, so take that with a grain of salt.

MONTANA

Bernie Sanders should clean house in Montana. This is for the following reasons:

  • Bernie Sanders has 83.87% of Democrat Facebook likes in Montana. Only in five states does he do better, Vermont, Maine, Idaho, Alaska, and Oregon, and he won all of these states by large margins.
  • Only in three states does Bernie have a higher relative number of campaign contributions, in Vermont, Alaska, and Oregon.
  • Montana is only 0.4% African American. Sanders does exceedingly well under these circumstances.

We should see a blow out in Montana. Clinton has surprised us all before (Wyoming…), but I would be exceptionally surprised to see a margin of victory of less than 15% here.

NEW JERSEY

Hillary Clinton should win New Jersey with ease due to the following reasons:

  • New Jersey is 13.7% African American, which is above the country average. As many of you know, Hillary does very well with African American voters.
  • Bernie has only 70.0% of Democrat Facebook likes in New Jersey, and in only ten states is this measure more unfavorable for him.
  • Bernie’s relative number of Google searches over the last three days is only 0.68. I do feel like this measure is losing its relevance as the campaign has went on, but regardless, this is the worst of all fifty states. Alabama comes in second with 0.832.
  • The only redeeming factor in New Jersey for Bernie Sanders is the fact that it is a semi-closed primary.

I believe that the margin of victory in New Jersey will be anywhere from 5-20%.

NEW MEXICO

New Mexico stands to be one of the most interesting elections on Tuesday. Other outlets are projecting a Hillary blow out here (and I’m not so sure about my projection that I would say that they are definitely wrong), but I am projecting a Sanders win for the following reasons:

  • New Mexico is Sanders 12th best state when it comes to the relative number of campaign contributions for him (he has not lost any state where he had a higher number than in this state), and he has won twelve other states in which he had a lower relative number of campaign contributions than in New Mexico.
  • Sanders has 79.49% of Democrat Facebook likes in New Mexico. He has not lost any state where he has a higher number than 79.49%, and he has won seven other states in which he had a lower percentage of the Democrat’s Facebook likes (i.e., a number lower than 79.49%).

These are the two primary drivers of my New Mexico Sanders win, but there are two major factors that may produce the alternative outcome.

  • New Mexico holds a closed primary. As many of you know, Sanders seems to generally do very poorly in this contest format, as he typically has a substantial reliance on independent voters. He has only won one closed primary, in Oregon, and that state was uniquely predisposed to give Sanders a win regardless of contest format type. However, Sanders did just come within a half a percentage point of Hillary Clinton in Kentucky two weeks ago in Kentucky’s closed primary. Sanders has a far greater relative number of campaign contributions in New Mexico than in Kentucky (2.42 versus 1.79), has a far greater percentage of Democratic Facebook likes in New Mexico than in Kentucky (79.49% versus 73.91%), and has a much smaller African American population in New Mexico than in Kentucky (2.1% versus 7.8%). It could be the case that Sanders is increasingly being viewed more favorably among lifelong Democrats, or that Kentucky was a lone anomaly.
  • New Mexico has the largest Hispanic population of any state, about 47%. Hispanics do seem to prefer Clinton (hypothetical example, if you were to randomly select 100 Hispanics in Kentucky, instead of voting 46.8% for Hillary as was the state result, these 100 Hispanics would vote 61.0% for Hillary. This effect is based on my analysis of about two hundred randomly selected counties from all over the U.S.), but my finding is that this effect is not so substantial as to produce a Hillary victory in New Mexico as it is fighting against the above factors; abnormally high campaign contributions and Facebook presence.

If Hillary does win New Mexico, a very real possibility, I believe that it will be because of the closed primary format, and not the effect Hispanics have. Hispanics do not seem to vote as “monolithically” as African Americans do according to all of my county level analysis (an analysis performed almost entirely to answer the New Mexico Hispanic question). Perhaps I am totally in left field predicting a Sanders win here, but all of the indicators that I rely on are pointing solidly in that direction.

NORTH DAKOTA

In case anyone wasn’t able to already predict that Sanders would win North Dakota, I’ll make the case.

  • North Dakota is only 1.2% African American, similar to Maine (1.2%), Vermont (1%), and Utah (1.1%). As you all know, Hillary lost these states by margins between 30-67%.
  • Sanders has a very high number of relative campaign contributions in North Dakota, among his best states, and not too dissimilar from the aforementioned Montana.
  • North Dakota also holds an open caucus, which Sanders does extremely well in (MN: 61.6%, ID: 78.0%, UT: 79.3%, WA: 72.7%). It literally does not get any better for Bernie unless the state is named Vermont.

I expect the margin of victory in North Dakota to be anywhere from 30-50%

SOUTH DAKOTA

South Dakota is highly similar to North Dakota, and for that reason Sanders should probably win by around the same amount.

  • South Dakota is also only 1.2% African American, similar to Maine (1.2%), Vermont (1%), and Utah (1.1%).
  • Sanders also has a very high number of relative campaign contributions in South Dakota, albeit slightly less than North Dakota. It is still among his best though.
  • Bernie has 78.57% of all Democrat Facebook likes in South Dakota, slightly higher than in North Dakota (76.9%). Only in a handful of states does he do better.
  • South Dakota, unlike North Dakota, holds a semi-closed primary. As mentioned before, Sanders still does well in semi-closed primaries, but not nearly as well as in open caucuses. This reduces his expected vote share compared to North Dakota, but together with the difference in Facebook presence, the differences are mostly a wash within my model.

Like North Dakota, I expect the margin of victory to be quite large. Though it is of course possible that Hillary will keep South Dakota closer than I estimate, I would be surprised if the margin of victory was less than 15%.


In conclusion, major kudos to both candidates for such a hard fought race. As you all probably could’ve guessed, I am a Bernie supporter, but despite my perceived shortcomings of Hillary, I do believe that she would make a good president. Obviously I would prefer that Bernie win, but with the system we have now (super-delegates), Bernie probably came as close as any seemingly unknown outsider ever could.

Lastly, I want to say THANK YOU to all of you that have consistently tuned in and listened to what I have had to say over this election season. It really means the world to me that hundreds of thousands of people care about and appreciate my work. Also, a special thanks to all of you who have donated to help fund the work that I do here, and have ensured that I have a roof over my head! I am truly blown away at the support I have received, and I’m very excited for all of the upcoming elections later this year. What started as just an experiment to see if Facebook and Google data were useful in predicting elections has blossomed into something much bigger, and, in my opinion, we are witnessing the birth of an entirely new methodology of predicting elections; one that will be more powerful in the future than we could have ever imagined.

-Tyler


DEMOCRATIC PRIMARY PROJECTIONS: KENTUCKY AND OREGON

As you all know, I’m just a graduate student with no income. If you would like to support my work and want me to be able to afford Top Ramen (or maybe even Mellow Mushroom pizza if you all are extraordinarily generous) while I’m working on these statistics, please click this link to donate to Tyler’s Food & Rent Fund!
Also, if you are an employer and have an open position, ideally in the D.C. area, I need a summer job! Please contact me if you think I would be a good fit for your organization. Paid positions only, please.


I am estimating that Bernie Sanders will win both primaries tomorrow, in Kentucky and Oregon. Using my metrics, Oregon seems poised to be a blowout Sanders victory, while Kentucky stands to be a hard-fought battle between both candidates for a win. I have put together an entirely new framework over the past week to account for votes going to other candidates, which is where my West Virginia projection fell most short. It is a more comprehensive model, and should be more accurate. For anyone concerned, my old model is generating very similar estimates for tomorrow. Here they are:

Screen Shot 2016-05-16 at 6.47.10 PM

KENTUCKY

The demographics of Kentucky favor Bernie Sanders. It is a white state with only a 7.8% African American population, similar to that of Kansas (5.9%), Wisconsin (6.3%), and Indiana (9.4%), all states that he has previously won. 7.8% is approximately at one standard deviation from the mean Black population percentage (4.2%) of the states that Bernie has won, meaning that it is not too far out of the ballpark for a Sanders victory. Bernie has also done quite well with campaign contributions in Kentucky, with the logged value of the relative number of <$200 contributions being 0.337. This is slightly under the average of states that he has won, 0.366, but far higher than the average of the states that he has lost, -0.07. These reasons are the primary drivers of my estimated Sanders victory.

Bernie’s Facebook presence in the state is poor, 73.91%, which is lower than any state he has won at this point. Bernie’s relative search interest in Kentucky is poor as well, with the three-day average currently at 0.927. The mean three-day average for all the states that he has won is 2.167, though just last week he won West Virginia at a relative search interest value of 0.94.

Lastly, Kentucky has a closed primary electoral format, which Bernie has never won before. Regardless of who actually wins the Kentucky primary tomorrow, I believe it will be a very close race.

Screen Shot 2016-05-16 at 7.32.23 PM

OREGON

Oregon is Bernie’s best state with the exception of Vermont when it comes to Facebook data. He has 84.314% of Democrat Facebook Likes, similar to Idaho (84.0%), Maine (84.09%), and Alaska (83.87%) (Vermont was 95.00%). Demographically, Oregon is about as good as it gets for Bernie. The African American population is only 1.8%, similar to Hawaii (1.6%), Utah (1.1%), and Alaska (3.3%). Only in Vermont and Alaska did Bernie outpace Hillary to a greater extent than in Oregon in the relative number of <$200 campaign contributions. These are the primary drivers of the massive margin of victory that I am projecting. It is difficult to reconcile the one and only poll (that showed Hillary with a 15% lead… but also had 19% undecided… and was also conducted well after ballots had already been received and presumably had already been mailed off by many voters) conducted in Oregon with this projection, but I refuse to arbitrarily tack on extra points because I have a hunch about something.

Oregon is entirely vote by mail. Clinton has traditionally dominated early voting, but Oregon’s format is unique to all the states that have already voted, so it is difficult to predict how much of an effect this will have. Personally, I doubt it will be significant due to practically every metric being overwhelmingly in Bernie’s favor (imagine Vermont was only vote-by-mail, would that have really changed the result?). Also, the party registration deadline was recent, April 26th. Bernie’s current relative search interest is quite low, but Oregonians began receiving their ballots two-three weeks ago. If we go back in the Google Trends data to April 26th (around the day voters began receiving ballots), Bernie’s relative search interest for the next week and a half was around 1.45; not bad. The average for all the states he has won is 2.167, but the standard deviation is 0.61, so 1.45 is not indicative of anything particularly remarkable.

Lastly, Oregon is also a closed primary, which Bernie Sanders has never won before.

Screen Shot 2016-05-16 at 7.33.22 PM

If the above estimates are correct, this should give Hillary Clinton a ~24 delegate deficit tomorrow. Good luck to both candidates, and happy voting to all you Oregonians and Kentuckians!

-Tyler

DEMOCRATIC PRIMARY PROJECTIONS: KENTUCKY AND OREGON

As you all know, I’m just a graduate student with no income. If you would like to support my work and want me to be able to afford Top Ramen (or maybe even Mellow Mushroom pizza if you all are extraordinarily generous) while I’m working on these statistics, please click this link to donate to Tyler’s Food & Rent Fund!


I am estimating that Bernie Sanders will win both primaries tomorrow, in Kentucky and Oregon. Using my metrics, Oregon seems poised to be a blowout Sanders victory, while Kentucky stands to be a hard-fought battle between both candidates for a win. I have put together an entirely new framework over the past week to account for votes going to other candidates, which is where my West Virginia projection fell most short. It is a more comprehensive model, and should be more accurate. For anyone concerned, my old model is generating very similar estimates for tomorrow. Here they are:

Screen Shot 2016-05-16 at 6.47.10 PM

KENTUCKY

The demographics of Kentucky favor Bernie Sanders. It is a white state with only a 7.8% African American population, similar to that of Kansas (5.9%), Wisconsin (6.3%), and Indiana (9.4%), all states that he has previously won. 7.8% is approximately at one standard deviation from the mean Black population percentage (4.2%) of the states that Bernie has won, meaning that it is not too far out of the ballpark for a Sanders victory. Bernie has also done quite well with campaign contributions in Kentucky, with the logged value of the relative number of <$200 contributions being 0.337. This is slightly under the average of states that he has won, 0.366, but far higher than the average of the states that he has lost, -0.07. These reasons are the primary drivers of my estimated Sanders victory.

Bernie’s Facebook presence in the state is poor, 73.91%, which is lower than any state he has won at this point. Bernie’s relative search interest in Kentucky is poor as well, with the three-day average currently at 0.927. The mean three-day average for all the states that he has won is 2.167, though just last week he won West Virginia at a relative search interest value of 0.94.

Lastly, Kentucky has a closed primary electoral format, which Bernie has never won before. Regardless of who actually wins the Kentucky primary tomorrow, I believe it will be a very close race.

Screen Shot 2016-05-16 at 7.32.23 PM

OREGON

Oregon is Bernie’s best state with the exception of Vermont when it comes to Facebook data. He has 84.314% of Democrat Facebook Likes, similar to Idaho (84.0%), Maine (84.09%), and Alaska (83.87%) (Vermont was 95.00%). Demographically, Oregon is about as good as it gets for Bernie. The African American population is only 1.8%, similar to Hawaii (1.6%), Utah (1.1%), and Alaska (3.3%). Only in Vermont and Alaska did Bernie outpace Hillary to a greater extent than in Oregon in the relative number of <$200 campaign contributions. These are the primary drivers of the massive margin of victory that I am projecting. It is difficult to reconcile the one and only poll (that showed Hillary with a 15% lead… but also had 19% undecided… and was also conducted well after ballots had already been received and presumably had already been mailed off by many voters) conducted in Oregon with this projection, but I refuse to arbitrarily tack on extra points because I have a hunch about something.

Oregon is entirely vote by mail. Clinton has traditionally dominated early voting, but Oregon’s format is unique to all the states that have already voted, so it is difficult to predict how much of an effect this will have. Personally, I doubt it will be significant due to practically every metric being overwhelmingly in Bernie’s favor (imagine Vermont was only vote-by-mail, would that have really changed the result?). Also, the party registration deadline was recent, April 26th. Bernie’s current relative search interest is quite low, but Oregonians began receiving their ballots two-three weeks ago. If we go back in the Google Trends data to April 26th (around the day voters began receiving ballots), Bernie’s relative search interest for the next week and a half was around 1.45; not bad. The average for all the states he has won is 2.167, but the standard deviation is 0.61, so 1.45 is not indicative of anything particularly remarkable.

Lastly, Oregon is also a closed primary, which Bernie Sanders has never won before.

Screen Shot 2016-05-16 at 7.33.22 PM

If the above estimates are correct, this should give Hillary Clinton a ~24 delegate deficit tomorrow. Good luck to both candidates, and happy voting to all you Oregonians and Kentuckians!

-Tyler

DEMOCRATIC PRIMARY PROJECTION: WEST VIRGINIA

Demographically, West Virginia seems like it should be a blowout in favor of Bernie Sanders. The polls, despite being all over the place, also seem to imply that West Virginia will be a blowout, with some giving Bernie a margin of victory as high as +28%(!). Recent polling has come back down to more believable margins, like +4% and +8%, which I think are much more in line with reality. Here is my estimate for what we will see tomorrow in the Mountain State:

Screen Shot 2016-05-09 at 6.50.51 PMWest Virginia is 3.4% African American, similar to states like Washington, Nebraska, and Colorado, all of which Hillary Clinton lost by margins that were quite large. But, there are other factors that point towards a <10% margin of victory. First, the relative search interest between the two candidates is leaning Hillary in West Virginia. The average relative search interest in all of the states that Bernie has won thus far is 2.23, whereas in West Virginia the relative search interest is 0.94; meaning that West Virginians are actually searching for Hillary Clinton more than they are Bernie Sanders. In fact, the lowest his three day relative search interest has ever been in a state that he ultimately won was 1.54 in Minnesota, and just last week in Indiana the relative search interest was 1.66. Secondly, Bernie’s share of Facebook Likes in West Virginia is only 75%, compared to an average of 81.2% for all of the states that he has won. I know that 6.2% doesn’t sound like much, but it really does make a big difference when you consider that the entire range of values for this measure is between 63.6%-95% (Mississippi-Vermont). West Virginia is also a relatively old state, with a median age of 41.9, compared to 37.78, which is the average median age of all the states that he has won.

Aside from this, West Virginia is a semi-closed primary, which usually helps Bernie slightly. In lieu of the Republican race being tied up at this point, it will be interesting to see if the semi-closed primary format attracts all of the independents to vote in the Democratic primary tomorrow. Also, Hillary’s comments on the coal industry have gotten quite a bit of media attention over the past week. This will probably help Bernie (even though Bernie pretty much has the same position on the issue). Also, the logged value of the relative number of campaign contributions is 0.36 in all of the states that Bernie has won so far, and in West Virginia this number is 0.405. This obviously looks positive for the Sanders campaign.

Lastly, on average, I underestimate Bernie’s vote share in semi-closed primaries by 3.27%, so I think we will end up with Hillary performing slightly worse in West Virginia than the numbers above indicate. Regardless, West Virginia is possibly the most unique state thus far with regard to the data that I look at. It’s really surprising how different pieces of data are really trying their best to pull my model very far in different directions in this state.

Thanks everyone, and happy voting to all of you West Virginians out there!

-Tyler

As you all know, I’m just a poor grad student. If you would like to support my work and want me to be able to afford Top Ramen (or maybe even Mellow Mushroom pizza if you all are extraordinarily generous) while I’m working on these statistics, please click this link to donate to Tyler’s Food & Rent Fund!

NUCLEAR PROLIFERATION AND LASER URANIUM ENRICHMENT

To the average person, uranium enrichment is something that feels too scientifically complex to understand. People typically only hear about enrichment in conjunction with a myriad of other advanced-sounding concepts, which can be off-putting for someone who would have otherwise wished to better understand this process. However, at a fundamental level, the enrichment process is actually quite simple, with the primary objective being that we wish to separate different kinds of uranium that are mixed together when it is mined from the Earth. At face value, this does not feel like a complicated task, but these two different types, or isotopes of uranium are practically identical in every physical way except for their weight, and the fact that one isotope of uranium is fissile. One isotope is called 238U, and it is mostly useless for the purposes of energy generation or nuclear weapons, but comprises 99.284% of all uranium that exists on Earth. The other isotope, 235U, is the one that we desire, because it can produce what we think of as a nuclear reaction. This is the basis for why nuclear power plants work and the basis for why nuclear weapons that use uranium explode. However, 235U, the useful isotope, only comprises 0.711% of all the uranium on Earth, and is homogeneously mixed within the 238U in uranium ore. It turns out that these two different types of uranium are incredibly difficult to sort, as there is only about a 1% difference in atomic weight between them, thus mankind continues to search for better, cheaper, faster ways to separate them. Recently, a technology has emerged that makes the sorting of these atoms much faster, which, in the context of nuclear proliferation, can be a bad thing.

The refinement of technology throughout civilization has followed a consistent pattern; machines become easier to use, more efficient with respect to resource consumption, faster at completing the process they were designed to perform, and for all these reasons, cheaper to operate. This is exactly what has happened with the technology that people have developed to enrich uranium over the past eighty years. The Manhattan Project saw the advent of the “gaseous diffusion” enrichment process, which was the most technologically advanced and cheapest process for separating uranium at that time. Gaseous diffusion was eventually replaced with the “gas centrifuge” enrichment process, which was much faster and could perform the same amount of separative work while consuming far less electricity. Centrifuge enrichment remains the primary enrichment process throughout the world now, but today we are at another crossroads, with lasers looking to take the enrichment industry by storm; bearing promise of much quicker uranium enrichment while supposedly using even less electricity to do it once the process has been optimized. People are getting better and better at sorting atoms.

ENRICHMENT METHODS

The gaseous diffusion process was cutting edge technology in the 1940’s, and operated on a very simple premise. The idea was to somehow turn uranium into a gas and push it through filters that could block the passage of the comparatively larger 238U atoms, while letting the smaller 235U atoms through at a faster rate. Scientists, engineers, and chemists succeeded by combining uranium with fluorine in a uranium-hexafluoride (UF6) compound[1], and then forcing this gas through advanced membranes that solved the problem of sorting (U.S. Nuclear Regulatory Commission). The end result was low-enriched uranium that could be used for nuclear energy generation, but if that low-enriched uranium was cycled back through the system many more times, you could ultimately yield uranium that was enriched to the point that it was almost entirely 235U. This is called highly-enriched uranium (HEU), and it is what is used in nuclear weapons. The gaseous diffusion process provided a means for governments to enrich uranium, but this process is really quite slow and uses a tremendous amount of electricity. These drawbacks prompted the advent of the next epoch of enrichment technology.

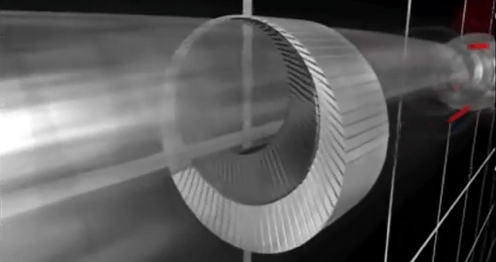
The centrifuge enrichment process completely changed the enrichment industry. By injecting the aforementioned UF6 gas into a centrifuge that is rotating at a very fast speed, the lighter 235U will tend to collect at the axis of rotation and also at the top of the cylinder, allowing it to be discriminately captured, while the heavier 238U will collect on the perimeter and bottom of the cylinder (U.S. Nuclear Regulatory Commission). This explanation makes this process sound deceptively simple, but in reality, these centrifuges are rotating at such a great speed (typically 50,000-70,000rpm) that they push the physical limits of the aluminum, steel, or carbon fiber components that they are made of. Regardless, these material’s problems were ultimately overcome, allowing processors to enrich uranium much faster while using about fifty times less electricity than the gaseous diffusion process to produce the same amount of material at the same level of enrichment (Cameco Corporation).

The invention of and later public arrival of lasers in the 1960’s prompted Los Alamos researchers to theorize a decade later that a finely tuned laser could be used to separate isotopes of uranium, but it wasn’t until the 21st century that this technology was effectively commercialized (SILEX Systems). Two different methods using lasers for enrichment purposes were developed: Atomic Vapor Laser Isotope Separation (AVLIS), and Molecular Laser Isotope Separation (MLIS). AVLIS relies on imparting an electrical charge on the individual uranium atoms by exciting the atom so much that it loses an electron and is ionized. The laser is able to discriminate between 235U and 238U due to the different atomic weights giving each atom a different spectral absorption band, much like an atomic resonant frequency. By precisely tuning a solid-state laser with a Nd-YAG lasing medium, one can induce the 235U atoms to absorb the energy, and the 238U atoms to effectively ignore it. This is no small feat, however, as it requires a laser wavelength so precise that it needs to be accurate to a single angstrom.[2] A negatively charged plate awaits the uranium vapor after it has been lased, which then captures the positively charged 235U (U.S. Nuclear Regulatory Commission).

Despite the viability of AVLIS, MLIS seems to have emerged as the method of choice for commercialization of laser enrichment.[3] The idea of using lasers for sorting isotopes was conceived at Los Alamos National Laboratory in the 1970’s, but SILEX Systems, an Australian company, is widely regarded as the commercial pioneer in this field (Los Alamos National Laboratory). SILEX began work on the process in the 1990’s and eventually licensed the technology to General Electric and Hitachi who are currently in the process of constructing a test facility akin to a large scale proof-of-concept (SILEX Systems). Fundamentally, MLIS shares many similarities with the AVLIS process, though there are some important distinctions. With the MLIS process, the uranium is processed as the UF6 compound, just as it is in conventional enrichment methods. The aim is to induce a chemical change within the compound by breaking the molecule in a specific way, and MLIS can do this by utilizing two different lasers sequentially. The first excitation laser typically uses a carbon-dioxide lasing medium, which outputs light in the infrared spectrum and is optically tuned to exactly 16μm. This is the frequency at which it will selectively excite the 235U atoms, generating atomic vibration and producing a state of general volatility in the molecule. After the UF6 molecules pass through the infrared laser, they then pass through the beam of a second laser which serves to break only the UF6 molecules that contain 235U with a quick, high-energy pulse of light tuned to a wavelength in the absorption spectrum of 235U (U.S. Nuclear Regulatory Commission). A good analogy for this process is the classic TV trope in which a character sings so loudly and at such a high pitch that wine glasses and windows begin to break after some time. The laser is effectively exploiting the resonant frequency of the excited molecules, and when it does, an electron that the uranium is sharing with any of the fluorine atoms (recall that the compound is UF6, a single uranium atom bonded to six fluorine atoms) breaks away from the molecule; this is called disassociation (Jensen, Judd and Sullivan). What remains is UF5 and a free fluorine atom, and the immensely useful property of UF5 is that it exists as a solid under the same pressure and temperature that UF6 exists as a gas! The UF5 immediately precipitates out of the UF6 gas as a powder, allowing for conventional filtration methods to physically separate it from the feedstock. All the while, a scavenger gas such as methane captures the free fluorine atom to prevent re-fluoridation of the UF5 (U.S. Nuclear Regulatory Commission). This UF5 precipitate contains a disproportionately larger amount of the 235U isotope than natural uranium ore, thus we can say that it has been enriched.

Aside from the fact that this process is impressively innovative and an elegant solution when it comes to sorting uranium atoms, it is also much faster. To compare the three different enrichment processes, we will look at the typical separation factor[4] for each technology:

Technology Separation Factor # Stages for LEU (4%)[5] # Stages for HEU (90%) Req. Facility Size
Gaseous Diffusion 1.004 440-1760 1800-7000 Large
Gas Centrifuge 1.05 – 1.2 10-36 39-145 Moderate
Laser Separation  2 – 6[6] 1-2 4-10 Small

What the above table tells us is that for a single kilogram of uranium to be enriched to the point that it is usable fuel in a nuclear power plant (assumed to be 4% 235U in this example), it would have to either pass through 440-1760 separation stages of membranes/diaphragms in a gaseous diffusion facility,[7] 10-36 separation stages of centrifuges (range due to differences in efficiencies between different models), or pass through an AVLIS/MLIS system one to two times. Similarly, it would take only 4-10 passes through an AVLIS/MLIS device to generate weapons grade uranium (assumed to be 90% 235U in this example), compared to 39-145 stages of centrifuges or 1800-7000 stages of gaseous diffusion. Depending on the throughput of each system, i.e. the volume of feed material that a system can process over an interval of time, AVLIS/MLIS is likely an order of magnitude improvement in enrichment speed over centrifuge enrichment; a true game changer. Furthermore, AVLIS/MLIS prevents 234U contamination of the enriched product, whereas gaseous diffusion and centrifuge enrichment actually exacerbate 234U contamination due to its lighter atomic weight (U.S. Nuclear Regulatory Commission). 234U is not desired in the final product, because just like 238U it is not capable of undergoing fission. Given these vast advantages that AVLIS/MLIS has over traditional enrichment methods, it is easy to see why it is such an attractive option for any entity that wishes to enrich uranium.

LASER ENRICHMENT AND PROLIFERATION

Some may read this and ask, ‘does this ground-breaking technology change the dynamics of the ongoing international push against nuclear proliferation?’ This question is really just analogous to asking if there would be more nuclear weapons states if it were easier to covertly manufacture nuclear weapons. Personally I believe the answer is yes, though I admit the answer is speculative. The biggest obstacle of nation-states that have aspirations to manufacture nuclear weapons at this point is the risk they assume when they build an enrichment facility, as they are taking a chance that U.S. satellites will discover it and subsequent questions will be raised. What has changed is that these enrichment facilities no longer have to be large, as AVLIS/MLIS is a much more compact system.

AVLIS and MLIS both use a comparatively much smaller footprint than centrifuge and diffusion methods when speaking of the required infrastructure associated with the technologies. Centrifuges used in uranium enrichment are truly massive devices, with some advanced carbon fiber designs up to forty feet tall and and two feet in diameter, and a typical facility would house several thousand of them (Glaser). Gaseous diffusion plants are notoriously enormous and bulky, requiring large cooling systems and would typically, at any given time, be using hundreds or even thousands of megawatts of power as they try to force their uranium gas through the aforementioned membranes (Centrus Energy). Both of these types of facilities are much easier to identify from satellite imagery because of their size and unique features. Laser enrichment, however, allows for the capability to quickly produce an appreciable amount of weapons-grade fissile material in a small facility that is correspondingly difficult to detect. There is no requirement for any particularly large cooling systems, and though these systems do use a large amount of power compared to similarly sized civilian facilities, it’s not such a remarkably large amount of power that it requires substantial electrical infrastructure that is easily identified (U.S. Nuclear Regulatory Commission). This means that it will be much easier to hide enrichment infrastructure for countries that wish to trudge down the nuclear path. Though it is generally desired to reduce the size and increase the efficiency of practically any machine humans have ever invented, the “bulkiness” of conventional enrichment infrastructure happens to be useful because it’s distinctive and easier to detect.

It is already challenging enough to prevent the proliferation of nuclear weapons. It is fundamentally in every state’s interest to obtain one, because nuclear weapons function as a strong “final-word” to any sort of serious foreign-relations quarrel. Look to the decade long dispute between the United States and Iran regarding the Iranian nuclear program. This particular chronology serves to illustrate how difficult it is to reverse the course of an advanced nuclear program once it is already in place. Over ten years elapsed before a multilateral agreement with Iran was reached, and many people in both countries are still not satisfied with the result. The global community is also currently dealing with a seemingly aggressive, nuclear armed North Korea, with no particularly great solution in sight. In a hypothetical world where one could instantly obtain weapons grade fissile material by putting uranium ore into some kind of magical enriching machine, there is no doubt that every nation would have vast stockpiles of it. Obviously we do not live in that hypothetical world, but it does stand to reason that if enriching to weapons-grade concentrations of 235U is made easier in any way, more of it will be produced. Guns were, at one point in history, very difficult and time consuming to manufacture, and for that reason they were a rarity. That is, of course, not the case anymore. The introduction of AVLIS/MLIS prompts us to ask ourselves if, collectively, civilization is mature enough for the proliferation rapid enrichment capabilities.

Furthermore, enriched uranium is already quite cheap. This is especially apparent when one looks at how much of the generated electricity cost is due to the initial fuel costs for different power generation technologies. For instance, a study performed several years ago in Finland compared nuclear with gas, coal, and wind power, and quantified how many cents of a nuclear generated kilowatt-hour went to fuel costs, i.e. uranium ore and the cost to process and enrich it. For nuclear power, only 11.4% of the cost of a kilowatt-hour can be attributed to fuel costs, whereas this number is 59.7% for natural gas, and 25.5% for coal. This means that even if nuclear reactor operators were able to obtain their enriched uranium for free, the price of a kilowatt-hour produced by a nuclear reactor would only hypothetically fall from 2.37  to 2.10 ; as capital costs and operations and maintenance expenses comprise almost all of the costs associated with producing nuclear power (World Nuclear Association). Perhaps electricity producers would be able to scrape a small amount of profit from the increased savings on enrichment by using lasers, but it is doubtful that any of these savings will be passed onto consumers. In other words, if there is any energy generation technology that really needs to increase the efficiency of their fuel acquisition process, it’s certainly not nuclear. The emergence of cheap natural gas has, to some extent, necessitated innovation and cost reducing measures in the nuclear industry to ensure that it remains competitive, but the security concerns associated with rapid enrichment seem to outweigh the benefits.

INTERNATIONAL REGULATORY SOLUTIONS

At this point, there is no turning back the clock on AVLIS/MLIS. The genie is out of the bottle. The very fact that I was able to write this research paper with some degree of technical accuracy regarding the laser enrichment process is testament to that. The technical specifications of the SILEX process are technically classified by the U.S. government, but there is enough knowledge available on the Internet alone for any large team of physics, chemistry, and engineering PhDs with government level funding to set up a laser enriching facility and eventually get it working through some trial and error. In other words, though this is highly advanced technology, it is not as if it is out of reach for modernized countries like Saudi Arabia, Turkey, or Egypt to do themselves.

There is the possibility that the International Atomic Energy Agency (IAEA) could impose an international regulation on the usage of lasers for uranium enrichment purposes. It is plausible that a regulation could ban the operation of industrial scale, multi-kilowatt lasers being operated at certain wavelengths in the absorption spectra of the 235UF6 molecule or the 235U atom, but this presents a few issues. First, humanity has advanced its understanding of lasers to such an extent that, on a global scale, it is somewhat commonplace to find people who are familiar with laser tuning. Moreover, there are now several different readily employed methods one can use to achieve a highly specific wavelength in a relatively short amount of time.[8] Tuning a laser into or out of a specific wavelength is by no means an easy thing to do, but it is not prohibitively difficult for an individual who has studied photonics. This would largely prevent the IAEA from ever being able to catch someone using a laser for uranium enriching purposes “red-handed,” and this is not to mention the complexity of wavelength testing, especially in a closed system.

Secondly, the AVLIS/MLIS processes have applicability and usefulness outside of the nuclear power and weapons industries. These processes can be utilized for purposes of purifying radioisotopes that are used in the medical industry (Eerkens, Kunze and Bond). Regulation could make this peaceful application much more troublesome, as teams would presumably be forced to shutdown their operation and/or dismantle their systems for periodic inspections. Third, if the United States were to become the country that ultimately called for international regulation of industrial scale lasers that could be used for isotope separation, there is the diplomatic implication of hypocrisy. The U.S. is one of only a handful countries that have explored this technology, and is the only country currently constructing a commercial scale laser enrichment facility. Many countries already resent the U.S. for seemingly not making any meaningful reduction in its nuclear weapons stockpiles (Wan). Thus, the acquisition of and subsequent call for no other country to use an AVLIS/MLIS system will only serve to intensify this sentiment.

CONCLUSIONS

Technological innovation is a good thing that all of humanity can harvest benefits from. The average individual would be hard-pressed to identify practically any instance in which new technology made all of global society worse off. However, technology related to the advancement of weapons is an obvious exception, and it can easily be argued that the uranium enrichment industry falls into this category. It is unique in the sense that the technology enrichers employ could be gravely harmful if it were to fall into the wrong hands, and AVLIS/MLIS most certainly will at some point in the future. There is no doubt that the AVLIS/MLIS processes have peaceful and otherwise useful applications outside of the nuclear energy industry, but if we are to embrace this technological process, we must also come to terms with, and accept the accompanying risks of provoking further nuclear weapon manufacturing capabilities.

It is troubling to argue against such a state-of-the-art and an elegant solution to the problem of sorting uranium atoms. Laser isotope separation is a triumph of human innovation, and a triumph of modern science. However, it becomes morally paralyzing when trying to reconcile the advancement of chemistry and physics as academic disciplines with the potentially harmful real world applications of the innovations themselves. For this reason, I believe that one can rationally appreciate the scientific achievement of inventing and demonstrating this process without simultaneously advocating for its use. The fact that nuclear weapons were invented is a testament to humanity’s scientific progress, ingenuity, and intellect, but that doesn’t mean that nuclear weapons were or are a good thing.

Though rapid uranium enrichment presents a potential threat to nuclear proliferation, one can take solace in the fact that it is arguably one of the most technologically advanced processes on Earth, and that the intellectual capital and resources required to make it work can only be found at the governmental level in relatively advanced nations.  This means that we do not have to worry about a dubious group of terrorists producing weapons grade uranium using lasers anytime soon. Furthermore, it is useful to remind oneself that even if an independent collective produces weapons grade uranium using a covert laser enrichment facility, one still has to build a bomb around the core. That is essentially just as difficult as building the laser to enrich the fuel. Beyond that is the requirement that this group also still has to build a delivery vehicle, such as a cruise missile that has satellite guidance, which is just as, if not more, difficult as building an AVLIS/MLIS system and a nuclear bomb. The point of saying this is to underscore the point that the laser enrichment process does not suddenly give every government the ability to produce and deliver a nuclear weapon. My aim is not to fear monger. My point is that it changes the calculus of that ability. It makes a relatively meticulous, bulky, expensive, identifiable process more efficient, more compact, less costly, and more clandestine. This is the reason that I believe we should focus on preventing the proliferation of this technology.

-Tyler

 FOOTNOTES

[1] Uranium-hexafluoride is particularly useful because it sublimes from a solid to a gas at a remarkably low temperature of 133°F.

[2] An angstrom is equal to one ten-billionth of a meter.

[3] This is largely because it is far easier to work with UF6 as a gas than it is to vaporize uranium metal.

[4] Defined as the quotient of the ratio of isotopes (235U/238U) after a stage of separation and the ratio of isotopes prior to separation.

[5] Number of separation stages required for 4% enrichment was calculated by using the separation factor of each respective technology sourced from the three cited U.S. Nuclear Regulatory Commission publications. Starting from natural uranium and separating to 4% could be achieved in a single stage if the technology had a separation factor of at least 5.82. From there, one can simply evaluate logx(5.82) where x is equal to the separation factor of the technology. The output of this log is the approximate number of stages that particular technology would require to reach a 4% concentration of 235U. The following HEU column is calculated in the same way, logx(1256.83).

[6] The separation factor of MLIS and AVLIS has been reported as anywhere from two to six. The technology is still largely in the developmental phase, and it is likely that a commercialized version of the technology will be able to achieve efficiencies towards or exceeding the upper end of this range.

[7] LEU at 440 stages in a gaseous diffusion plant is the theoretical minimum at a 1.004 separation factor, but many plants, like the plants in Portsmouth or Paducah, required up to four times this amount when they were still in operation.

[8] Perhaps the most common is the introduction of a specific dye into the lasing medium, hence the term “dye laser,” though there are other methods, such as simply shifting the output wavelength optically.


REFERENCES

Cameco Corporation. Cameco U101 Fuel Processing: Enrichment. 2016. 20 April 2016. <https://www.cameco.com/uranium_101/fuel-processing/enrichment/&gt;.

Centrus Energy. Paducah Gaseous Diffusion Plant. 2013. 20 April 2016. <http://www.centrusenergy.com/gaseous-diffusion/paducah-gdp&gt;.

Eerkens, Jeff, Jay Kunze and Leonard Bond. “Laser Isotope Enrichment for Medical and Industrial Applications.” 14th International Conference on Nuclear Engineering. Miami: Idaho National Laboratory, 2006. 1-13.

Glaser, Alexander. “Characteristics of the Gas Centrifuge for Uranium Enrichment and Their Relevance for Nuclear Weapons Proliferation.” Science and Global Security 2008: 1-25.

Jensen, Reed, O’Dean Judd and Allan Sullivan. “Separating Isotopes with Lasers.” Los Alamos Science December 1982: 2-33.

Los Alamos National Laboratory. Los Alamos Science No.4 – Winter/Spring 1982. December 1982. 1 May 2016. <http://la-science.lanl.gov/lascience04.shtml&gt;.

SILEX Systems. SILEX History. 2016. 28 April 2016. <http://www.silex.com.au/History&gt;.

U.S. Nuclear Regulatory Commission. “Uranium Enrichment Processes: Gas Centrifuge.” 21 October 2014. USNRC Technical Training Center. 6 May 2016. <http://pbadupws.nrc.gov/docs/ML1204/ML12045A055.pdf&gt;.

—. “Uranium Enrichment Processes: Gaseous Diffusion.” 21 October 2014. USNRC Technical Training Center. 4 May 2016. <http://pbadupws.nrc.gov/docs/ML1204/ML12045A050.pdf&gt;.

—. Uranium Enrichment Processes: Laser Enrichment Methods (AVLIS and MLIS). 21 October 2014. USNRC Technical Training Center. 1 May 2016. <http://pbadupws.nrc.gov/docs/ML1204/ML12045A051.pdf&gt;.

Wan, Wilfred. “Why the 2015 NPT Review Conference Fell Apart.” 28 May 2015. United Nations University Centre for Policy Research. 2 May 2016. <http://cpr.unu.edu/why-the-2015-npt-review-conference-fell-apart.html&gt;.

World Nuclear Association. The Economics of Nuclear Power. March 2016. 3 May 2016. <http://www.world-nuclear.org/information-library/economic-aspects/economics-of-nuclear-power.aspx&gt;.

DEMOCRATIC PRIMARY PROJECTION: INDIANA

I’m only aware of one other outlet that is projecting a Clinton loss tomorrow in Indiana. Though Bernie Sanders has scaled back spending in Indiana, Hillary has cut all spending from states that have yet to vote in the Democratic primaries, presumably to save funding for the general election campaign against Trump (edgy assumption, I know). This Clinton spending cut seems to be showing up in the Google Trends data for Indiana, as Bernie has seemed to have drastically increased his search interest relative to Hillary. Here are my estimates for what we will see tomorrow night:

Screen Shot 2016-05-02 at 8.01.28 PM

Something about this projection doesn’t feel very right to me, though I suppose this concern is rooted in the surprisingly consistent polling results showing Hillary with a win. Despite this, every different configuration of my model, six total, is showing a Bernie win in Indiana. I have devoted quite a bit of time over this past week trying to see if it was possible to generate a different result, but it just wasn’t possible within my framework. Perhaps Hillary will win, and perhaps Hillary will lose, but regardless, I do think it will be very close.

There doesn’t seem to be any particular factor within all of my data that is significantly driving this result, though if I had to choose one I suppose it would be his slightly higher-than-average share of Facebook likes within the state, 78.5%, similar to Michigan (80.0%), Kansas (78.5%), Illinois (76.1%), and Missouri (76.9%). The Republican open primary that is being held tomorrow in Indiana will help Hillary by stealing independents that would’ve voted for Bernie, likely by around 0.4% (already factored into the above projection).

Michigan is perhaps the best analogue for Indiana. The Facebook data is very similar, and they are both open primaries. I believe that both have also had a minimal amount of early voting. One somewhat stark difference between the two states are the respective portions of the populations that are African American, with Michigan at 14.2% and Indiana at 9.4%, so Bernie should gain an advantage over Michigan in this respect. However, in Michigan, Bernie had a higher relative search interest measure (from Google Trends), about 14% higher. Bernie also had a higher number of individual campaign contributions in Michigan compared to Indiana; where he had about 1.56 times more <$200 contributions than Hillary in Michigan, and only 1.31 times more <$200 contributions in Indiana.

Thanks for the interest everyone, and happy voting to all you Hoosiers!

-Tyler

As you all know, I’m just a poor graduate student. If you would like to support my work and want me to be able to afford Top Ramen (or maybe even pizza if you all are extraordinarily generous) while I’m working on these statistics, please click this link to donate to Tyler’s Food & Rent Fund!

(edit: Also, if you are an employer in the DC area and have an open position, I need a summer job! Please contact me if you think I would be a good fit for your organization. Paid positions only, please.)