Though I seek to be accurate with margins of victory and loss with the projections I post here, even more important than that are the predictions of whether a candidate will win or lose a contest. As many of you already know, I got two consequential calls wrong last Tuesday, and missed two more by significant amounts. Hillary Clinton won Missouri by 0.2%, and won Illinois by 1.6%; both very small margins. Though numerically I missed the win/loss in these states by 0.2% and 1.6%, I fully recognize that the difference is night and day. This is why I started over, from scratch, and have spent the last two days building a more robust and comprehensive model that can account for factors that I had previously thought were indirectly contained within the variables I was using.
- Why did Bernie under-perform my estimates in almost every state Tuesday? Was it coincidence or a systemic mathematical bias of my model?
I believe it was more coincidence than mathematical bias, though I will concede both to some degree. I do want to make it clear that there was no intentional bias (I have been accused numerous times of inflating Bernie’s numbers for some imaginary reason), but rather the structure of the model itself created a mathematical bias in four of these last five elections. I say it was coincidental because the factors that allow this bias to show appeared disproportionately in most of Tuesday’s states, particularly states with an open primary.
Illinois, Missouri, and Ohio all have open primaries. Up until this point, the open primary was not a statistically significant driver of results for either candidate, and therefore was not included in my model. However, over this past month, more and more Democrats (apparently a disproportionate number of Sanders rather than Clinton supporters) have been requesting Republican ballots in open primaries to cast anti-Trump votes. They seem to harbor more disdain for Donald Trump than support for Bernie Sanders. I was able to isolate this effect and subsequently include it in the new model by interacting the amount of Trump support on social media in a state with a binary variable that defines whether the state has an open primary or not. This is a powerful variable, because it accounts for the scale of anti-Trump sentiment. In states that have more Trump support, more Democrats will cast anti-Trump votes, disproportionately helping Hillary Clinton. This happened to a substantial extent in Illinois, Missouri, and Ohio.
I am also now factoring in the median age of the state in question. Though Sanders has won some “older” states like Maine, New Hampshire, and Vermont, he does better overall in “younger” states, statistically speaking. Florida and Ohio are both older states, with a median age of 41.6 and 39.4, respectively. This is now being accounted for and will help produce more accurate results.
I have heard the claim many times that northerners and southerners, and particularly minorities, just vote differently from an ideological perspective. I don’t disagree, but I had previously believed that this bias was contained in the social media data that I was using. I have been experimenting with including a variable to track whether a state is in the “Deep South,” and as it turns out, this variable is statistically significant. In my opinion, this is the primary reason that Hillary Clinton performed so much better than my expectations in Florida. Even accounting for so many different things, people that reside in an area that possesses a southern culture will simply vote for a more conservative candidate.
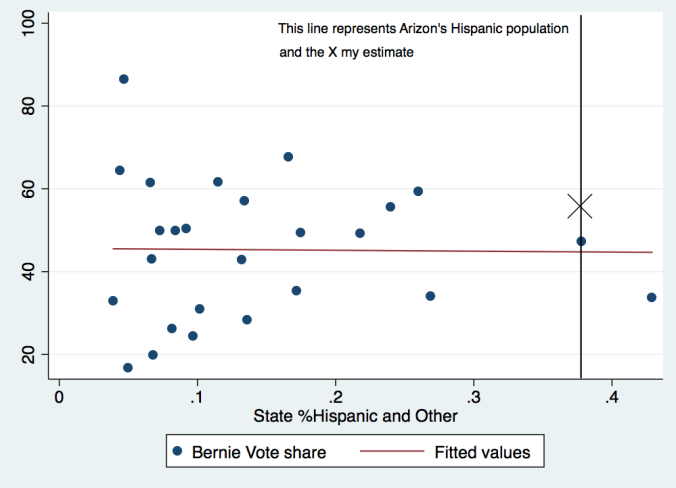
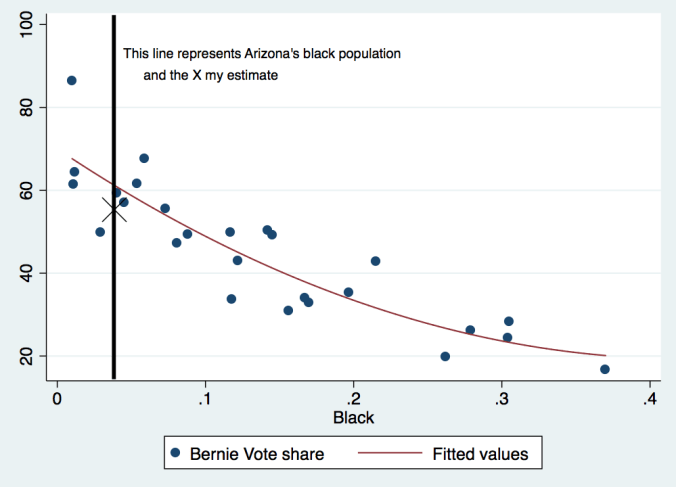
I am happy for the opportunity to refine the model in so many different ways. This is, at its very core, an experiment to determine whether it is possible to model primary elections without the aid of public polling. I have a renewed confidence in the projections for the next few weeks, and look forward to determining once and for all which candidate Hispanics prefer with the Arizona contest next week.
-Tyler


 Hillary’s greatest advantage at this time is likely all of the early ballots that have been cast in Arizona. Other states have shown us that residents who are proactive enough to cast early ballots seem to vote disproportionately for Hillary Clinton (older people, of course). Who knows if this trend will hold true in Arizona, though I imagine it will.