MICHIGAN, MISSISSIPPI DEMOCRATIC PRIMARY PROJECTIONS

It’s a bit unsettling to go against the grain with this forecast. As far as I know, every outlet is projecting a Clinton win tomorrow in both Michigan and Mississippi.

The Sanders campaign must be doing something remarkable in Michigan right now, because the upswing in Sanders popularity among my data sources is undeniable. I am seeing levels of interest in Bernie Sanders in Michigan similar to that of Colorado, Oklahoma, Kansas, and Nebraska. This, along with Michigan’s relatively normal demographic makeup, leads me to personally believe that he does have a chance. It leads my model to estimate that he will win there. Hillary leads every conventional poll, however, which makes me skeptical of these numbers.

Bernie Sanders will be lucky to get above 20% in Mississippi, but I do believe that if he doesn’t win Michigan, the final results will be very close. Here are the numbers:

Screen Shot 2016-03-07 at 11.35.52 PM

My official prediction is that Bernie will win Michigan and Hillary will win Mississippi, but in reality Michigan is too close to call with a mathematical model. Elections culminate in a single number after the movement of hundreds or thousands of variables, and as statisticians we can only select a few of those and hope that we account for as much variance as possible. Given the outcome of all the other elections so far this season, the positions of those variables right now in Michigan seem to indicate that a massive upset will happen tomorrow night.

-Tyler

KANSAS, LOUISIANA, NEBRASKA, MAINE DEMOCRATIC PRIMARY/CAUCUS PROJECTIONS

After projecting one incorrect result on Super Tuesday, in the state of Minnesota, I was able to refine my forecasting models further. There does seem to be some variability in these outcomes that I am currently unable to account for, e.g. if the models predict a win in Minnesota, a win in Iowa also should have happened. Iowa could without a doubt be a special case for our purposes, as it was indeed the first state to hold a Democratic Caucus, both candidates had been campaigning there relentlessly for months, and so on. Therefore, it stands to reason that, looking backwards, perhaps it was Iowa that was the anomaly, and not Minnesota. Sanders outperformed my estimates in every state except Texas, Alabama, and Arkansas; with these states of course having in common the characteristic of being southern and having a larger minority population.

Fortunately, these next four states seem to be firmly in one or the other candidate’s favor. Here are the new projections:

Screen Shot 2016-03-04 at 9.35.51 PM

Hillary Clinton will win Louisiana by a significant margin, but the subtle and interesting characteristic of this estimate (as my colleague Matt pointed out to me) is that the estimated margin of victory seems to be smaller than other similar states. For instance, Georgia, Alabama, and South Carolina are almost identical in demographic makeup as Louisiana, yet Clinton won all those states with greater than 70% of the vote. This could signal that Bernie Sanders is becoming increasingly more popular with the minority community.

Bernie Sanders is projected to win the other three states, Kansas, Nebraska, and Maine. Though these states have relatively few delegates up for grabs, this will still be a victory for his campaign insofar that it should create some positive momentum for his campaign after he lost the majority of the Super Tuesday states. Honestly, I expected the estimates for Kansas and Nebraska to signal a more hotly contested race, but the data from the past three days shows that the residents of these states are certainly feeling the Bern.

Special thanks to Andrew, Phil, and Matt for their collaboration and thoughts.

-Tyler

SUPER TUESDAY DEMOCRATIC PRIMARY AND CAUCUS PROJECTIONS: REVISED

It has become clear that the social media data that I used in my previous forecast became antiquated quite quickly, due to the relatively large margin between the South Carolina estimate and actual result.

Thanks to a good friend’s tip, I began to utilize data from Google Trends to develop new estimates for Super Tuesday. Looking in retrospect, the correlation between the Google data and results in the first four states is striking once one has massaged the data set to produce usable measures (I use relative search frequency averaged over the couple days prior to the election). Demographics are taken into account as well. The new estimates are as follows:

Screen Shot 2016-03-01 at 12.22.32 AM

This produces an estimated delegate allocation as follows (super-delegates are not included in this table):

Screen Shot 2016-03-01 at 12.27.15 AM

Once we have the data from Super Tuesday, we will all be able to hone the accuracy of our models even further.

-Tyler

2016 DEMOCRATIC PRIMARY PREDICTIONS

I have recently been developing a statistical model for the sake of predicting the electoral outcomes of the Democratic primaries. I have used the first three primaries, Iowa, New Hampshire, and Nevada, to gather the relevant data for the model. This model is experimental in the sense that I am using data that has been aggregated from social media to make my estimates. To my knowledge this has never been done before, but after this election season we will be able to determine the viability of social media political sentiment as a proxy for broader public political sentiment.

There are many elements and controls to any good statistical model, and at this point there is not enough variance in some of the variables that I would like to include; nor is there enough observations to truly call anything statistically significant. However, the model will continue to get more and more accurate as the primary season progresses. Regardless, I am very confident in the predicted Super Tuesday (and beyond) outcomes at this point. Here are the estimates:

Screen Shot 2016-02-23 at 3.05.05 PM

Massachusetts and Oklahoma are italicized and bold because I have determined they are too close to call. By slightly changing one of the underlying assumptions in my model, a different winner results. I do believe that Bernie will win Massachusetts and Hillary will win Oklahoma, but that is really no more than conjecture. I hope you all find this interesting. For anyone with a background in statistics and/or econometrics that would like to know more about the fundamentals of my model, just shoot me an email and I would be happy to discuss it with you.

-Tyler

THE PRICE OF PROSPERITY: AIR POLLUTION IN MEXICO AND INDIA

Air pollution is a problem that every developed nation has had to deal with at some point in their history, albeit some more than others. As economic development progresses, educational standards are achieved, and the standard of living is raised for the population at large, citizens will begin to demand cleaner air and environmental protection. For both India and Mexico, a legislative push to protect the environment emerged in the 1980’s to early 1990’s. Mexico City was named the most polluted city in the world in 1992, but while Mexico was cleaning up, Delhi went on to achieve this same title in 2013. Why is it that two federal democracies, whose efforts to curtail air pollution have both been significant and began at roughly the same time, have had such drastically different outcomes with respect to environmental regulation? It is hypothesized that these different outcomes are primarily the result of critical institutional, legal, and socioeconomic differences between Mexico and India. Each country’s capital city will be used as a proxy for this comparison.

MEXICO

The United Nations named Mexico City the most polluted city in the world in 1992, bringing international focus to the horrible environmental conditions within the country (United Nations Environment Programme 1992). The city, topographically circumscribed within a valley, had such terrible air quality that birds would drop dead in flight. Smog was so intense that, from within the city, you couldn’t see the mountains around it. Extreme concentrations of particulate matter decreased the life expectancy of its inhabitants and posed a severe public health risk. At the local and state levels, ecological concerns had consistently taken a backseat to the rapid economic growth and industrialization that Mexico experienced for the decades leading up to the United Nations report. For the federal government however, shaping governmental institutions to adequately address these problems had begun two decades prior, but it was only until this institutional capacity reached a critical mass in the early 1990’s that substantial progress could finally be made.

For about thirty years, Mexico went through a period of institutional shuffle as environmental issues became more and more important to the people. This began in 1972 with the creation of the “Secretariat for Environmental Improvement” under the umbrella of the Ministry of Health and Welfare. In 1982, the Federal Environmental Protection Act created the Ministry of Urban Development and Ecology (SEDESOL). These developments were followed by the creation of the National Water Commission in 1989, the National Institute of Ecology (INE), and the Federal Attorney for Environmental Protection (PROFEPA), which were then consolidated into the Ministry of Environmental, Natural Resources, and Fisheries (SEMARNAP) in 1994. In 2000, the fisheries subsector was moved into the Secretariat of Agriculture and the institution was once again restructured, leading to the Secretariat of Environment and Natural Resources (SEMARNAT) that we know today (SEMARNAT 2013). The creation and dissolution of this myriad of governmental agencies may seem overwhelmingly complicated and inefficient today, but this reflects a history of commitment to environmental preservation. The federal government of Mexico has constantly refined and streamlined the institutional structure of SEMARNAT and its predecessors to ensure responsiveness in the face of growing ecological concerns, and to ensure that the institution possessed an effective set of tools to confront these problems before they grew so large that they could not be managed.

The environmental regulatory framework has been largely defined by the General Law of Ecological Balance and Environmental Protection (LGEEPA) of 1988 (SEMARNAT 2014). This piece of legislation clearly defined the role of all three levels of government in regulating air pollution, and laid the basis from which the PROAIRE program could derive its resounding success over the following two decades. LGEEPA dictates that the federal government is responsible for “formulating and conducting national environmental policy,” with this power legally exercised by the president through SEMARNAT. There are other federal responsibilities under this law, such as issuing environmental standards and defining reporting mechanisms, but the role of the federal government that is outlined is limited to primarily management of state and local entities. The law also gives individual states, in addition to the federal government, the power to design and implement their own “economic instruments” to encourage and discourage certain environmentally relevant activities and to “promote greater social equity in the distribution of costs and benefits associated with the objectives of environmental policy.” It is the role of the states and of municipalities to develop emission reduction plans in their respective jurisdictions, and to then submit these to SEMARNAT for review and approval (Ley General Del Equilibrio Ecológico Y La Protección Al Ambiente 1988). In practice, the state and municipal authorities have engaged the “academic, private, and non-governmental sectors of each city,” so as to formulate policy that works for all parties involved (SEMARNAT 2014). The LGEEPA structure provides accountability, intuitive delegation of authority, and a pathway for escalation that gives the state strength in enforcing these regulations.

            The PROAIRE program that was implemented through the original LGEEPA legislation gave states and municipalities a significant amount of breathing room to develop their own plans and to determine what would work best in their locales. Mexico City took a particularly aggressive approach to combat dangerous levels of pollution within the city, and this has resulted in substantial reductions of dangerous pollution as well as a large reduction in CO2 emissions. From 1989 to 2015 SEMARNAT found that the PROAIRE program reduced PM10 (particulate matter less than ten microns in diameter) from 175μg/m3 to 40μg/m3, airborne lead from 1.4μg/m3 to 0.05μg/m3, and carbon monoxide from 7ppb to 1ppb. Monitoring of PM2.5 began in 2004, and since has been reduced from 25μg/m3 to 20μg/m3 (Secretaría del Medio Ambiente 2015). These emission reductions are despite a 9.3% increase in the federal district’s population during this time. The city was able to use the legal and institutional framework to, among other things, force power plants to move outside of the densely populated areas, institute a “no-drive-day” once per week, create a bike-sharing program, and convert the entire city bus fleet to natural gas. In addition to this, and as mandated by the LGEEPA legislation, the city has continually devoted a significant sum of resources to a public information campaign (C40 2013). This focus on education will continue to foster a public sentiment that values a clean environment and results in the citizens doing their part as well.

INDIA

In the same United Nations report that named Mexico City the most polluted city in the world in 1992, Delhi was considered to be at risk of further deteriorating air quality. Despite the extremely limited atmospheric monitoring infrastructure, upward trends had begun to expose themselves, providing a glimpse into a dismal future. These trends were driven by “increasing motor vehicle numbers” and a “rapid rate of industrial expansion.” The report concludes “epidemiological data are urgently needed,” referring to a “high incidence of tuberculosis” that had been linked to pollutants, signifying that by the early 1990’s air pollutants had become a major public health concern (United Nations Environment Programme 1992). Like Mexico, though, the federal government had begun to take action to two decades prior, passing legislation to create regulations that would presumably curtail these problems.

In contrast to Mexico, India has involved itself very little of this “institutional shuffle,” and has addressed the pollution problem mostly through the creation of new environmental law. The environmental conscious of India was sufficiently pricked with respect to environmental preservation with the passage of the Stockholm Declaration at the international level in 1972, of which India was a signatory. This prompted parliament to add two articles to the constitution, saddling the government with a mandate to “protect and improve the environment.” This was followed by the passage of the Water Act of 1974, the Water Cess Act of 1977, the Forest Conservation Act of 1980, the Air Act of 1981, the Environment Act of 1986, the National Environment Tribunal Act of 1995, and several others. Of these, it is perhaps the Water Act of 1974 that was most institutionally significant, as it was responsible for the creation of the Central and State Pollution Control Boards; the first governmental agency that had the responsibility to enforce environmental legislation (Agarwal 2005). Even after the creation of the Department of Environment in 1980 and its later transformation to the Ministry of Environment and Forests in 1985, the pollution control boards have seemed to remain the de facto institutions to identify and reprimand offenders (Indian Institute of Science 2014). The hierarchical structure, as well as the responsibilities, of these boards has largely remained the same since their creation decades ago.

Much attention to air pollution in India over the past two decades has, perhaps strangely, come from the judiciary. The Supreme Court has frequently, in times of regulatory or executive inaction, taken on a very active role to institute entirely new environmental regulations in the form of what are called “Supreme Court Action Plans” (SCAPs) beginning in 1996. What makes the history of these SCAPs slightly peculiar lies in the ability of the Supreme Court to bring a public interest suit against the state itself; i.e. the court is granted automatic standing under Indian environmental law (Greenstone and Hanna, Environmental Regulations, Air and Water Pollution, and Infant Mortality in India 2013). When the government has caved to pressure from industry or the public, the Court has often stepped in to force the government to follow through with environmental plans they had already indicated would be implemented. The Supreme Court has acted as a bulwark against this adverse political influence from industry, and its actions have been particularly effective (Narain and Bell 2005).

            Historical air pollution trends are uniquely difficult to quantify for India, due to the lack of data. The CPCB first instituted the National Air Monitoring Programme (NAMP) in 1984, but because resources have been so limited for this program, the proliferation of an adequate number of monitoring stations has been incredibly slow (Central Pollution Control Board 2003). There are still an insufficient number of monitoring stations in 2015, and the lack of regular processing and reporting of these figures produces very low-resolution trends. Technology is not installed to differentiate between PM2.5 and PM10 at many of the sites, a necessity to accurately study air pollution and the public health effects of it. It is known that PM2.5 and PM10 concentrations have continued to increase in Delhi over the past several decades, driven by a rapidly increasing population and increasing numbers of personal vehicles, and currently sit at levels that constitute a major health risk. The most recent data puts Delhi’s PM10 concentration at 286μg/m3 in 2013, up from 148μg/m3 in 2004. PM2.5 concentration stood at 153μg/m3 in 2013, the highest of any major city in the world, up from approximately 135μg/m3 in 2010 (World Health Organization 2015). These significant concentrations of respirable particulate matter have been linked to a decrease in life expectancy for Delhi residents of approximately 3.2 years (Greenstone, Nilekani, et al. 2015).

India’s greatest success thus far has been the reduction in lead and carbon monoxide to levels that are negligible, mostly due to the implementation of the Bharat vehicular emissions standards and the mandated use of catalytic converters on personal vehicles. The implementation of these policies is attributable to the Supreme Court, after the Ministry of Environment and Forests reneged on their prior commitment (Narain and Bell 2005). India has undoubtedly made progress in curtailing some pollutants throughout the country, but the problems are growing faster than their capacity to mitigate them.

DIFFERENCE IN OUTCOMES

            One major contributing factor to the difference in performance between environmental regulation in India and Mexico is the fundamentally different institutional structure of the regulatory agencies. The Ministry of Environment and Forests of India is a ministry that has no presence in the Council of Ministers, as the head of this department is a “Minister of State” as opposed to a “Minister.” This means that the head of the Ministry of Environment and Forests cannot take part in cabinet meetings and has no cabinet minister in the union government that oversees him or her. Though the ministry itself possesses executive authority, they do not answer to a president, and instead ultimately answer to the Indian parliament. SEMARNAT of Mexico is a department within the executive cabinet, with the secretary being appointed by the president himself. The Secretary of Environment answers to the president of Mexico, and in practice is typically allowed to engage in more independent policy making without excessive fear of political blowback, especially in the case of a lame duck president. Because the Indian Ministry of Environment and Forests is subservient to parliament, and parliament would presumably be more fearful of political backlash as a result of harsher environmental regulation, we should not expect this ministry to engage in as much rule or policy making, even despite its executive power.

Lower levels of governance, when left to their own devices, are less likely to institute ambitious environmental protection regulations when compared to federal-level agencies for fear of political scrutiny, due to their proximity to the community they will affect. This problem is exacerbated in India, where the state pollution control boards are comprised exclusively of individuals that have been nominated and confirmed within the state legislature. This naturally produces boards that will have more difficulty remaining objective, as they are presumably subservient to the legislature that put them in their positions. This diminishes their sense of independence and to some degree their autonomy, making them particularly vulnerable to powerful political pressures from industry. The members of these boards do serve three-year terms, but are eligible for re-nomination in perpetuity (The Air Prevention and Control of Pollution Act 1981). In this context, the organization of the pollution control boards create an incentive structure that is more akin to a political position rather than a administrative-bureaucratic position. This is very different from the environmental regulatory agencies that exist at the state level in Mexico. Mexican state governments are structured very similarly to that of the federal government, meaning that each state has its own environmental secretariat, with the secretary being appointed by the governor and the rest of the organization being highly bureaucratic (Constitution of Mexico Article 116 1917). The resulting institution is one that is highly impersonal compared to India’s numerous pollution control boards; a desirable trait for regulatory agencies in particular. In the disciplinary field of comparative politics, it is accepted that the degree to which institutions are impersonal have a positive relationship with the resulting strength of the state unto which it is a part (North, Wallis and Weingast 2009). Insofar as this is true, this would imply that Mexico, at least at the state level, possesses more institutional capacity, and a higher propensity to enforce regulations that are in place.

            Confrontation of environmental issues in India seems to lack a congruous and unified approach among jurisdictions. It is indeed the duty of the Central Pollution Control Board to “plan and execute a nationwide program for the prevention, control, or abatement of air pollution,” and “coordinate the activities of the States,” but much of what has seemed to occur at the national level is simply setting concentration standards for pollutants and instructing the states to ensure they are met (The Air Prevention and Control of Pollution Act 1981). The environmental secretariat of Mexico instituted the first nationwide program, PIICA, in 1990. Following this, it instituted the aforementioned PROAIRE program in 1996 and has renewed this program twice since (Álvarez, Lara and Moreno 2009). Programs like PIICA and PROAIRE serve to do three things. First, by synthesizing all relevant environmental regulation and pollution standards, they present clearly defined goals through a standalone doctrine. Secondly, they have the ability to capitalize off of nationalist sentiment to create the aforementioned unified and consistent approach across jurisdictional lines. Lastly, these programs raise awareness throughout the bureaucracy and the populace, helping to influence public sentiment and make citizens more sympathetic to the overall cause. India has no such comprehensive nationwide program, opting instead to pass over 200 different pieces of environmental legislation but never integrating these regulations into a program that the country can rally around to spur rapid progress (Agarwal 2005). It stands to reason that this is due to a lack of capacity, resources, or political capital.

            A substantial amount of variability in environmental outcomes is certainly attributable to the wealth disparity between Mexico and India. In 1990, which is approximately when pollution mitigation became a national focus in both countries, GDP per capita in Mexico was $3,068 (2015 dollars), whereas GDP per capita in India was $375. In 2014, the GDP per capita of Mexico was $10,230, with India growing to $1,595 (The World Bank 2015). On a percentage basis, India has vastly outperformed Mexico and most other countries in real GDP growth over the past twenty-five years, but in per capita terms India still falls quite short. Given their comparative lack of wealth, this would indicate that India simply has different priorities than a country like Mexico. There are still large numbers of impoverished people in India, some without enough food to eat or access to electricity. From a governmental humanitarian standpoint, it would make little sense to direct any meaningful amount of resources to advanced air pollutant reduction technologies, and with regard to air pollution specifically, there is little doubt that clean water programs would take priority anyways. From a civil society standpoint, the people of India would presumably be naturally drawn to pool their resources and time to address the shortages of these basic human needs rather than the curtailment of air pollution.

Even considering all of the legislative efforts that India has made to clean up pollutants and mitigate the emission of them, the country has wrangled for years with the lackluster enforcement of existing environmental law. Take, for instance, an experiment that was conducted several years back in the Gujarat state. Pollution control boards are legally required to carry out inspections of industry to ensure they are not in violation of any environmental regulations, but because of a lack of resources the board had instead been requiring that firms hire their own inspectors. The effects of this conflict of interest were exposed with this experiment, when the board employed inspectors themselves. As a result, it was found that emissions had been systematically understated in the past, inspectors began reporting truthfully, and firms began reducing their emissions of pollutants (Duflo, et al. 2013). This study exposed in real terms the cost of an insufficient amount of institutional capacity.

Legally, the pollution control boards possess the power to completely shut down firms if they are in violation of environmental law, or even have firm managers arrested and charged criminally, but these laws are rarely enforced. There is a possibility that pollution control board members feel a strong connection to their community, and do not want to be the ones responsible for putting so many people out of work in a country that has a significant amount of unemployed and low wages to boot. Because advanced social welfare programs are so limited, this is a serious humanitarian and political risk that few would ever be willing to take. Furthermore, in the context of foreign investment, harsh environmental regulations or enforcement thereof would only serve to deter multinational corporations from locating in India. It is clear that India has attempted to establish a very broad scope of activities that the government is to be involved in, but lacks the institutional strength to adequately enforce these regulations. India may be better suited to pursue a more modest regulatory approach to satisfy the balance between state scope and strength in a more sufficient manner.

CONCLUSION

            India and Mexico are two countries that share a fair amount of similarities when viewing them through a wide lens. However, upon further examination regarding the dramatically different environmental outcomes, one can begin to hone in on numerous institutional and socioeconomic differences that may explain Mexico’s relative success and India’s struggle. Strong bureaucratic regulatory agencies in Mexico have utilized their executive authority to implement sweeping national programs, and are better suited and more likely to enforce existing regulations due to the political independence of the institutions. Most importantly, the relative wealth that Mexico possesses compared to India better positions Mexico in their fight against air pollution; allowing them to direct more resources at the infrastructure they need, public information and awareness campaigns, and enforcement activities. Though both countries have made laudable efforts to curtail air pollution, it was Mexico that possessed a sufficient amount of state capacity to make genuine progress, and it was India that “spread its butter too thin.” Like many cases in the field of comparative politics, the reasons for the difference in outcomes here is nuanced, and consists of both governmental and socioeconomic factors.

REFERENCES

Álvarez, Violeta, José Lara, and Adolfo Moreno. Evaluación Y Seguimiento Del Programa Para Mejorar La Calidad Del Aire En La Zona Metropolitana Del Valle De México 2002-2010 . Evaluation, Universidad Autonoma Metropolitana-Azcapotzalco, Mexico City: SEMARNAT, 2009, 15-16.

Agarwal, V. K. “Environmental Laws in India: Challenges for Enforcement.” Bulletin of the National Institute of Ecology 15 (2005): 227-238.

C40. Mexico City: ProAire. 2013. http://www.c40.org/profiles/2013-mexicocity (accessed November 25, 2015).

Central Pollution Control Board. Guidelines for Ambient Air Quality Monitoring. Report, Ministry of Environment & Forests, Delhi: CPCB, 2003, 13.

Constitution of Mexico Article 116. (1917).

Duflo, E, M Greenstone, R Pande, and N Ryan. “Truth-telling by Third-party Auditors and the Response of Polluting Firms: Experimental Evidence from India.” Quarterly Journal of Economics 128, no. 4 (2013): 1449-1498.

Greenstone, Michael, and Rema Hanna. Environmental Regulations, Air and Water Pollution, and Infant Mortality in India . Working Paper, Department of Economics, Massachusetts Institute of Technology, Cambridge: MIT, 2013.

Greenstone, Michael, Janhavi Nilekani, Rohini Pande, Nicholas Ryan, and Anant Sudarshan. “Lower Pollution, Longer Lives: Life Expectancy Gains if India Reduced Particulate Matter Pollution.” Economic and Political Weekly, February 2015: 40-46.

Indian Institute of Science. Pursuit and Promotion of Science. Publication, Bangalore: IISc, 337.

Ley General Del Equilibrio Ecológico Y La Protección Al Ambiente. (El Congreso de los Estados Unidos Mexicanos, El Diario Oficial de la Federación 1988).

Narain, Urvashi, and Ruth Bell. Who Changed Delhi’s Air? Discussion Paper, Washington: Resources for the Future, 2005.

North, Douglass, John Wallis, and Barry Weingast. Violence and Social Orders. Cambridge: Cambridge University Press, 2009.

Secretaría del Medio Ambiente. Sistema de Monitoreo Atmosferico. December 1, 2015. http://www.aire.df.gob.mx (accessed December 1, 2015).

SEMARNAT. Background of SEMARNAT. December 1, 2013. http://www.semarnat.gob.mx/conocenos/antecedentes (accessed November 21, 2015).

—. Management Programs to Improve Air Quality. September 26, 2014. http://www.semarnat.gob.mx/temas/gestion-ambiental/calidad-del-aire/programas-de-gestion-para-mejorar-la-calidad-del-aire (accessed November 23, 2015).

The Air Prevention and Control of Pollution Act. (Indian Parliament, March 29, 1981).

The World Bank. GDP per capita. 2015. http://data.worldbank.org/ (accessed November 29, 2015).

United Nations Environment Programme. Urban Air Pollution in Megacities of the World. Report, Oxford: Blackwell Publishers, 1992.

World Health Organization. Ambient Air Pollution. 2015. http://www.who.int/gho/phe/outdoor_air_pollution/en/ (accessed December 1, 2015).


YELLOWCAKE AND THE GREENHOUSE BLUES

            Greenhouse gas (GHG) emissions from anthropogenic sources, more specifically emissions of carbon dioxide (CO2) through energy intensive processes, are predicted to accelerate on a non-linear trend that began at the onset of the Industrial Revolution in the 19th century. The growing concentration of CO2 from the combustion of fossil fuels has begun to warm the atmosphere, and beginning only a few decades ago, society became aware of not only the presence of more GHGs in our atmosphere, but also became conscious of the implications with respect to human civilization. Several different sources of renewable energy have become popular and are marketed as substitutes for fossil fuels, such as photovoltaics and wind. However, these sources are still largely too expensive to be adopted by utilities that have traditionally provided their customers with a pricing structure rooted in cheap electricity from coal. Compared to these renewable sources, nuclear power generation has some advantages that humans will have to rely on in the coming decades while manufacturing processes are optimized to make solar, wind, and battery technologies more economically viable.

NUCLEAR ROADBLOCKS

            If there is one historically unifying theme for nuclear power, it is that it seems to have been consistently under-utilized. 439 nuclear reactors are in operation today, in thirty countries, with only fourteen of those countries generating more than 20% of their overall electricity consumption with nuclear. Only three countries, Hungary, Slovakia, and France use nuclear sources to provide the majority of their electricity (IAEA 2015). This trend seems to be due to several different factors, the first of which being the relatively high capital and financing cost of constructing a new nuclear power plant, coupled with long construction time scales. The upfront capital required for a nuclear plant is higher than any other energy generation technology with the exception of offshore wind power and coal-gasification integrated combustion cycle (IGCC) with carbon capture and storage (CCS). Total overnight cost, which includes engineering, procurement, and construction costs, but also excludes interest on financing, came to $671/kW for modern combustion turbine designs that utilize coal as fuel. This is in very stark contrast to modern nuclear reactor installations that have recently averaged $5,366/kW total overnight cost in the United States (U.S. Energy Information Administration 2015). It is easy to see why utilities prefer traditional fossil fuel plants with such a substantial difference in upfront costs, but this is only a piece of the story.

            Compared with every other energy generation technologies, a new nuclear plant takes longer than any other installation to bring online without even considering regulatory or political roadblocks. While a conventional coal or gas plant could be completed in about three years from date of order, a nuclear plant is expected to take about eight years (U.S. Energy Information Administration 2015). Add to this the nearly unanimous tendency for nuclear projects to be delayed while still under construction, and you have a nuclear plant that in some cases ends up costing 75% more than initially estimated (World Nuclear News 2014). This is a tremendous investment risk for private investors, governments, or utilities, and has consistently made the estimation of plant cost wildly unpredictable. Delays on nuclear projects are so common that a project being completed on time has become the exception rather than the rule.

            Capital and financing issues are not the only problems with trying to bring new nuclear online. Beginning with the first major nuclear accident in Chernobyl, nuclear has been characterized as being unacceptably dangerous in many countries around the world. There have been countless public demonstrations against nuclear power, with every subsequent nuclear accident revitalizing public opposition and sparking mass protests throughout the world. The meltdown of three reactors at the Fukushima Daiichi power plant in 2011 is classified as the second worst nuclear accident in history and has resulted in a massive international response, despite no deaths having been attributed to the disaster at this time. Most notably, Chancellor Merkel of Germany made a commitment in the days that followed the Fukushima accident to accelerate the decommissioning of all of Germany’s nuclear reactors (Reuters 2011). It is also estimated that this disaster alone will result in only half the previously estimated new nuclear capacity by 2035 due to public concerns, though some of the major markets such as India and China are expected to proceed with earlier plans to vastly increase their share of nuclear power capacity (The Economist 2011). China has since reiterated its commitment, with a planned completion of 129 new reactors by the year 2030 citing considerable public health concerns with air quality in major population centers, as well as an increasing international focus on the mitigation of CO2 emissions (Forbes 2015). Nuclear disasters have been a regular source of waning interest in the nuclear sector for decades now, but there does seem to be momentum in the industry. Nuclear electricity generation is a very effective way to offset CO2 emissions, and the politicians know this, but the public is cautious. Just as the Ukrainian ghost town of Pripyat was contaminated with radioisotopes after the meltdown at Chernobyl, the phrase “nuclear power” has been contaminated with ideas of apocalypse and catastrophe. There must be a relentless focus on improving reactor technical safety and redundancy, as well as improving human safety protocol and inspection measures to reassure the public that this technology is overwhelmingly safe when compared to other forms of energy generation.

            The issue of nuclear waste handling has been a source of contentious debate for decades, and will likely continue well into the future. Traditionally, many countries treated all of the spent nuclear fuel as waste; despite the spent fuel containing only <5% undesirable actinides and fission products. This “spent” fuel can be reprocessed to separate the undesirable contents from the portions of uranium and plutonium that are still valuable, but because reprocessing this fuel requires relatively expensive infrastructure and new nuclear fuel is relatively cheap, it has never been in the economic interests of a company or government to build a fuel reprocessing plant. Despite this, many countries have done just that, partly to reduce fuel costs by recycling the spent fuel, but also because reprocessing makes waste disposal much easier by concentrating the dangerously radioactive waste into a smaller volume. The United States has had a very lackluster history with regard to nuclear waste disposal, choosing not to reprocess spent fuel and also to simply store it in sealed “dry-casks” above ground (Hashem 2012). This is a very inexpensive method of disposal, but many argue is unsustainable and presents unacceptable levels of risk to the public.

            If humanity is to rely on nuclear power to a greater extent in the future, the nuclear fuel cycle must be normalized among countries to create continuity, consistency, and predictability. This would involve a commitment by every country with nuclear capacity to extract the most radioactive actinides from spent fuel to reduce the volume of waste, and then permanently “freeze” this waste in an insoluble compound such as borosilicate glass or synthetic rock. This ensures that if this high level waste were to ever come into contact with water, it could not leach out and pose a health concern. Countries with nuclear capacity also need to normalize the way in which they ultimately dispose of this high level waste after reprocessing. Projects are underway in several different countries at this time to develop geological repositories up to 500m deep, well below the water table in a majority of the world (World Nuclear Association 2012). These repositories must be subject to several constraints, including but not limited to proximity to population centers, proximity to aquifers, and geological stability. This strategy provides multiple layers of protection against an accidental radiological release into the biosphere, and seems to be the best nuclear waste policy at this time. It is likely, though, that the populations of people closest to these sites will be vehement opponents of this disposal process, making it politically difficult to implement.

RENEWABLES AND NUCLEAR

            There are no CO2 emissions associated with producing electricity at a nuclear power plant, and also no harmful emissions like mercury or sulfur that are produced when burning coal. An estimated 60 GW of coal capacity is estimated to be retired by 2020 in the United States with the advent of new Mercury and Air Toxics Standards (MATS) that requires “significant reductions in emissions of mercury, acid gases, and toxic metals,” and the Clean Power Plan that limits CO2 emissions by plant type (U.S. Energy Information Administration 2014). This means that it is currently advantageous to begin planning base load replacement in the form of nuclear plants. Because an average sized coal plant in the United States has a capacity of 250 MW, and an average sized nuclear plant has a capacity of just over 1 GW, the net effect to overall grid capacity would be insignificant if society were willing to invest in one nuclear plant for every four coal plants that closed. Coal provides about 30% of the United States power, and a good starting point for a long term CO2 mitigation strategy would be to aim to replace all coal power with nuclear sources, leaving the last 70% to ultimately be entirely comprised of wind, solar, and hydroelectric capacity (U.S. Energy Information Administration 2013). For every 1 GW of coal capacity replaced by nuclear capacity, on average, 4 MtCO2 is avoided per year. Hypothetically, if all coal capacity in the United States were replaced with nuclear, 1.38 GtCO2 would be avoided annually; equivalent to 4.27% of global CO2 emissions (Davis and Socolow 2014).

            There is no doubt that renewable energy sources must play a substantial role in the future, but nuclear must still be a critical component of the world’s electricity generating capacity for many years to come. There are several reasons for this, with the first being that the nature of wind and solar power is inherently intermittent. Wind power output can usually be assumed to be equivalent to the turbine operating at 100% capacity for 2,200 hours per year, and for most of the United States, solar can be assumed to generate electricity for about 2,400 hours per year (Landsberg and Pinna 1978). This is in contrast to coal, natural gas, and nuclear plants that can be assumed to operate around 8,000 hours per year, with the only downtime being for maintenance or when electricity demand falls to a point that utilities would lose money by keeping a plant operating. What this means is that there must be a great deal of innovation in the energy storage sector to store power generated by wind or solar for use at night or when the wind is not blowing, likely in the form of lithium ion batteries, or it means that we must supplement a renewable energy system with plants that we have the ability to turn off and on. Because advanced battery technology is still prohibitively expensive, this means that we must use nuclear in conjunction with wind and solar to provide a base load of power, support the grid in times of need, and to offset CO2 emissions.

            Another disadvantage that wind and solar possess is that the electricity generation potential varies wildly from region to region, even sub-nationally. In the United States, states in the northwest such as Montana and Idaho have wind potential areas that are upwards of 1000W/m2, whereas many of the southern states like Louisiana, Mississippi, Alabama, and Florida have no wind potential at all aside from possible offshore installations, and even most of those top out at a potential of only 100W/m2 (University of Montana 2008). With solar resources, states in the southwest such as California, Arizona, and Nevada have vast portions of their states that receive over 9.0kWh/m2/day in June, while states in the northeast like New York, Pennsylvania, and Massachusetts receive in the range of 4.0-5.0kWh/m2/day, making it twice as effective to generate solar power the southwest (National Renewable Energy Laboratory 2004). The implications of this are that it would be inefficient to generate power from these renewables in the “wrong” locations, and that it would make more sense to generate in energy dense locales and transmit the power elsewhere, though this would vastly increase transmission loss.      The point is that renewable energy is geographically and topographically constrained to a much more considerable degree than nuclear is. It will be necessary to locate nuclear plants in places that do not make solar or wind “sense,” with the only local requirement being some source of freshwater for cooling. This makes nuclear versatile compared to coal and natural gas as well, because coal plants are often located as close to the source of the coal itself due to transportation cost, and natural gas transportation requires expensive underground pipelines. Nuclear reactors consume a very small amount of fuel per kWh in terms of volume and weight when compared to these sources, thus alleviating many logistical concerns that the fossil fuel industry must face.

URANIUM SUPPLY

            Though nuclear is undoubtedly preferable to fossil fuels for the sake of GHG emissions, we must bear in mind that uranium is a finite natural resource. The consequence of this is that nuclear power, using current infrastructure and identified resources, is a medium-term solution for energy scarcity at this time, and cannot be considered the end-all solution to energy scarcity with current reactor technology. Globally, current identified resources of uranium in all cost categories are estimated at 13.5Mt, and at 2012 rates of uranium consumption this would provide a 120-year global supply. Undiscovered resources, estimated based off of geological data and regional geographic mapping, are estimated to amount to about 7.7Mt. Based on identified resources alone, this implies that a doubling of nuclear capacity would in principle reduce this supply from 120 years worth of uranium to 60. Fortunately, relatively higher uranium prices have resulted in more exploration for new sources. Because of this, total identified resources increased 10.8% in only the two years from 2011-2013 (OECD NEA & IAEA 2014). A trend like this will do well to mitigate any concerns utilities or governments have about a uranium shortage within the next several decades. Uranium also exists in seawater at a concentration of 0.003ppm, and could potentially be extracted if land resources became difficult enough to mine. Early research suggests that if uranium prices exceed $600/kg, it could become profitable to extract from seawater (World Nuclear Association 2015).

            One breath of fresh air with respect to potential uranium scarcity is the breeder reactor design, which operates in a fundamentally different manner than the widely used boiling water reactors (BWR), pressurized water reactors (PWR), and CANDU reactors. The advent of the nuclear era brought with it the idea that uranium was a scarce element, which directed focus to research on new reactor designs that could more efficiently extract energy from the fuel. This is the primary benefit of a breeder reactor, superior fuel economy when compared to conventional designs. Breeder reactors achieve this by not “moderating” the neutrons produced in fission, which is the role of water in nearly all reactors currently in operation. The presence of water slows the neutrons and makes them more apt to be captured by and split fissile nuclei like 235U, and also less likely to be captured by the non-fissile 238U that comprises a majority of the nuclear fuel. Without a neutron moderator, the neutrons possess a much higher energy, allowing them to more easily be captured by the non-fissile 238U, which captures two protons and converts to fissile 239Pu. Breeder reactors can also use a thorium fuel cycle, which increases efficiency even more. The takeaway is that a breeder reactor creates its own fuel that can be reprocessed into a suitable nuclear fuel on a regular basis. Where conventional reactors can extract less than one percent of the potential energy in terms of the amount uranium ore it takes to produce a viable nuclear fuel, breeder reactors can increase this “by a factor of about 60,” (World Nuclear Association 2015). This principle in conjunction with the theoretical viability of seawater uranium extraction effectively turns nuclear fuel into a source of renewable energy.

            Breeder reactors have the added benefit of addressing a large portion of the nuclear waste problem. Actinides, heavy elements that are not a product of a split atom but rather a neutron capture, are the primary source of radioactivity in traditional nuclear waste. Because of the un-moderated higher energy neutrons in a breeder reactor, these actinides become an actual part of the fuel cycle. Because of this design, a breeder reactor can theoretically burn all of these actinides and leave only lighter and less radioactive fission products. Due to geometric and physical constraints of the fuel, however, this can only be achieved with the continuous reprocessing of fuel (Bodansky 2006). The breeder reactor shows future promise, though it will likely not become popular for new installations until uranium ore is sufficiently expensive and radioactive waste storage capacity becomes overwhelmingly problematic.

PROLIFERATION

            How can society encourage the mass adoption of nuclear power in countries that are not yet concerning themselves with clean energy? Currently, the world powers are reluctant to assist in bringing new nuclear capacity to developing countries for various reasons, but perhaps most of all because of national security concerns. There is an undeniable risk that a nuclear power program, no matter the specifics, could provide some degree of a framework for a terrorist group or a rogue administration to develop nuclear weapons. There are possible solutions to nuclear weapons proliferation, though nearly all would be immensely politically challenging to implement because they all require some level of oversight and capacity for verification.

            First, the world powers could mandate that new nuclear capacity in potentially problematic countries must be constructed using the Canadian Deuterium Uranium (CANDU) reactor design, which permits the usage of fuel without enrichment. This is important, as uranium enrichment infrastructure can essentially be thought of as the tool that enables the creation of a nuclear bomb. The CANDU design nullifies this because the reactor is designed to use heavy water, water that possesses a hydrogen atom with an atomic mass of two otherwise known as deuterium, to moderate neutron emission of the fuel. The heavy water itself will capture fewer neutrons and works in some respects similar to the aforementioned breeder reactor, enabling higher energy neutrons to be captured by the 238U which transitions to fissile 239Pu, resulting in the existence of overall criticality in the reactor without enriched fuel.

            However, there are still concerns with the CANDU design. There are only a handful of heavy water manufacturers in the world, and shipping large quantities could be logistically challenging; and this is without even considering its exorbitant cost of several hundred dollars per kilogram. Also, as mentioned, CANDU reactors rely on creating much of their power through the fertilization of 238U to convert it to 239Pu. Provided a reasonable fuel reprocessing facility and scientific know-how, this 239Pu can be isolated from the rest of the waste and can potentially be used to create a nuclear warhead, assuming there are large enough quantities available. Tritium is also an incidental creation in a CANDU reactor when the deuterium atom captures another neutron. Tritium can be used to create a nuclear fusion reaction that can drive a traditional fission reaction, and greatly increases the amount of energy released when arranged in the proper way. This is what is called a “two-stage nuclear,” “thermonuclear,” or “hydrogen” bomb, and is the most powerful weapon that is publicly known to have been created. This tritium can also periodically be harvested from the heavy water in the reactor (International Panel on Fissile Materials 2013). Because this waste poses a hypothetical danger in the wrong hands, the International Atomic Energy Association (IAEA) must be able to monitor the nuclear waste produced in these countries to ensure that none is being diverted to a covert processing plant with the intent of weaponizing the material.

            Lastly, the world powers could develop a global supply chain through the IAEA, whereby only carefully vetted vendors from trusted sources are allowed to enrich, manufacture, and transport nuclear fuel. This would facilitate the use of conventional and cheaper light water reactor (LWR) designs, eliminating concerns about incidental tritium production, heavy water availability, and most of the concerns with regard to the incidental production of 239Pu. In addition to total supply chain management, including nuclear waste management, there must be surveillance capacity at nearly every stage of the nuclear electricity generation process. This strategy also prevents enrichment infrastructure, which is perhaps the most important concern, but the greatest challenge with this approach is the political feasibility. A country would be required to allow a United Nations agency to essentially trample on their sovereignty by having the authority to inspect virtually any facility anywhere at any time within their borders. Requiring the countries to purchase fuel from verified vendors that are likely to exist in some other country is an additional aspect they are unlikely to find ideal. The very existence of this sort of an agreement does not particularly foster a friendly political relationship, and rests on the presumption that the new nuclear country cannot be trusted.

            Assuming the later mechanics of inspection and verification process can be achieved, there is still the question of how new nuclear projects will be developed and financed. Working through the United Nations Framework Convention on Climate Change (UNFCCC) and the Special Climate Change Fund (SCCF), new nuclear proposals from developing countries or economies in transition could be refined by experts in the nuclear industry to ensure creditworthiness. The SCCF could provide lower interest debt financing compared to what the project would alternatively receive from the private sector, or use a cooperative equity model to mitigate more of the upfront costs to the recipient utility or government. Either of these strategies would help to encourage the adoption of nuclear over fossil fuel plants in countries that are expanding their energy capacity at this time, but would also ensure a return on investment for the SCCF. Also, Russia has been quietly securing contracts with other countries under a “build-own-operate” system, in which the Russian government uses their own nuclear technology to build and permanently operate a reactor in another country. This is advantageous for both parties, but has some geopolitical implications as “Russian-built nuclear power plants in foreign countries become more akin to embassies — or even military bases — than simple bilateral infrastructure projects,” (Armstrong 2015). Regardless, without the barrier of billions of dollars of upfront capital and financing costs, it is likely that nuclear projects will look more attractive to prospective countries. This is especially true when considering that nuclear is not subject to any hypothetical carbon taxes that may ultimately be introduced at a national or international level.

CONCLUSION

            Nuclear power will face a multitude of challenges going forward, from political and public opposition, waste management, and lack of capital for project finance, but will nonetheless remain a technology we are to rely on if we wish to deviate significantly from the amount of CO2 we are emitting. Wind, solar, and hydroelectric power capacity will certainly be of the utmost importance over the next century, but their intermittent nature coupled with the lack of economically viable battery technology prevents us from utilizing those energy sources for 100% of global energy demand at this time. Uranium supply does not currently seem to be any significant constraint on the future of nuclear energy, and with future extraction technologies and breeder reactors, this is theoretically a non-issue for millennia. The capability of weaponizing nuclear fuel will be troubling as nuclear power is adopted around the world, but with a comprehensive monitoring and inspection process through the IAEA and United Nations, this concern can be put to rest as well. CO2 emissions must be reduced drastically, but it is up to policy makers to determine viable ways to allow developing countries to continue to experience economic growth while also making the switch to cleaner energy sources.

REFERENCES

Armstrong, Ian. “Russia is creating a global nuclear power empire.” Global Risk Insights. October 29, 2015. http://globalriskinsights.com/2015/10/russia-is-creating-a-global-nuclear-power-empire/ (accessed November 3, 2015).

Bodansky, David. “The Status of Nuclear Waste Disposal.” American Physical Society 35, no. 1 (January 2006).

Davis, Steven J, and Robert H Socolow. “Commitment accounting of CO2 emissions.” Environmental Research Letters 9, no. 8 (2014).

Forbes. China Shows How to Build Nuclear Reactors Fast and Cheap. James Conca. October 22, 2015. http://www.forbes.com/sites/jamesconca/2015/10/22/china-shows-how-to-build-nuclear-reactors-fast-and-cheap/ (accessed October 23, 2015).

Hashem, Heba. “Recycling spent nuclear fuel: the ultimate solution for the US?” Nuclear Energy Insider. November 21, 2012. http://analysis.nuclearenergyinsider.com/operations-maintenance/recycling-spent-nuclear-fuel-ultimate-solution-us (accessed October 31, 2015).

IAEA. Nuclear Share of Electricity Generation in 2014. October 22, 2015. https://www.iaea.org/PRIS/WorldStatistics/NuclearShareofElectricityGeneration.aspx (accessed October 23, 2015).

International Energy Association. CO2 Emissions from Fuel Combustion. IEA, 2014, 54.

International Panel on Fissile Materials. India. February 4, 2013. http://fissilematerials.org/countries/india.html (accessed October 16, 2015).

Landsberg, H. E., and M Pinna. “L’atmosfera e il clima.” In UTET, 63. Torino, 1978.

National Renewable Energy Laboratory. Direct Normal Solar Radiation. June 2004. http://www.nrel.gov/gis/images/map_csp_us_june_may2004.jpg (accessed October 25, 2015).

Oak Ridge National Laboratory. 2013 Global Carbon Project. U.S. Department of Energy, Carbon Dioxide Information Analysis Center, U.S. DOE Office of Science, 2013.

OECD NEA & IAEA. Uranium 2014: Resources, Production, and Demand. Report, OECD Nuclear Energy Agency, 2014, 9.

Reuters. German govt wants nuclear exit by 2022 at latest. Annika Breidthardt. May 30, 2011. http://uk.reuters.com/article/2011/05/30/idINIndia-57371820110530 (accessed October 23, 2015).

The Economist. Gauging the Pressure. April 28, 2011. http://www.economist.com/node/18621367?story_id=18621367 (accessed October 23, 2015).

U.S. Energy Information Administration. AEO2014 projects more coal-fired power plant retirements by 2016 than have been scheduled. February 14, 2014. http://www.eia.gov/todayinenergy/detail.cfm?id=15031 (accessed October 28, 2015).

U.S. Energy Information Administration. Annual Electric Generator Report. Report, Washington: U.S. EIA, 2013, Table 4.3.

U.S. Energy Information Administration. Cost and performance characteristics of new central station electricity generating technologies. Annual Report, Washington: U.S. EIA, 2015, Table 8.2.

University of Montana. “Wind power for coal power.” The Maureen and Mike Mansfield Center. Ethics and Public Affairs Program. 2008. http://www.umt.edu/ethics/imx/climatechange/US_wind_power_map.png (accessed October 25, 2015).

World Nuclear Association. Fast Neutron Reactors. October 2015. http://www.world-nuclear.org/info/Current-and-Future-Generation/Fast-Neutron-Reactors/ (accessed October 24, 2015).

—. Supply of Uranium. September 2015. http://www.world-nuclear.org/info/Nuclear-Fuel-Cycle/Uranium-Resources/Supply-of-Uranium/ (accessed October 24, 2015).

—. “Waste Management.” World Nuclear Association. December 2012. http://www.world-nuclear.org/info/Nuclear-Fuel-Cycle/Nuclear-Wastes/Waste-Management-Overview/ (accessed October 31, 2015).

World Nuclear News. New Trends in Financing. September 15, 2014. http://www.world-nuclear-news.org/NN-New-trends-in-financing-1509201401.html (accessed October 22, 2015).

IOWA SENATE RACE 2014

The 2014 Iowa Senate race was a hard-fought campaign between two individuals that had vastly different visions for the future of America. In the red corner was Joni Ernst, a former lieutenant colonel in the National Guard and a member of the Iowa Senate. Ernst’s political career had been running smoothly and had been developing momentum since she was elected Montgomery County Auditor in 2004. In the blue corner was Bruce Braley, a member of the U.S. House of Representatives and successful trial lawyer. Braley had served in Congress since 2007, and it was time for him to take the next step: the U.S. Senate.

Unfortunately for Braley this dream didn’t work out in his favor, but why? How can a U.S. Representative that has been consistently reelected by large margins lose to a relatively new member of the Iowa Senate that wasn’t initially electorally popular for any reason other than one television advertisement? The importance of this election is not to be understated, as it was viewed nationally as the central indicator as to whether the Republican Party would take control of the U.S. Senate.
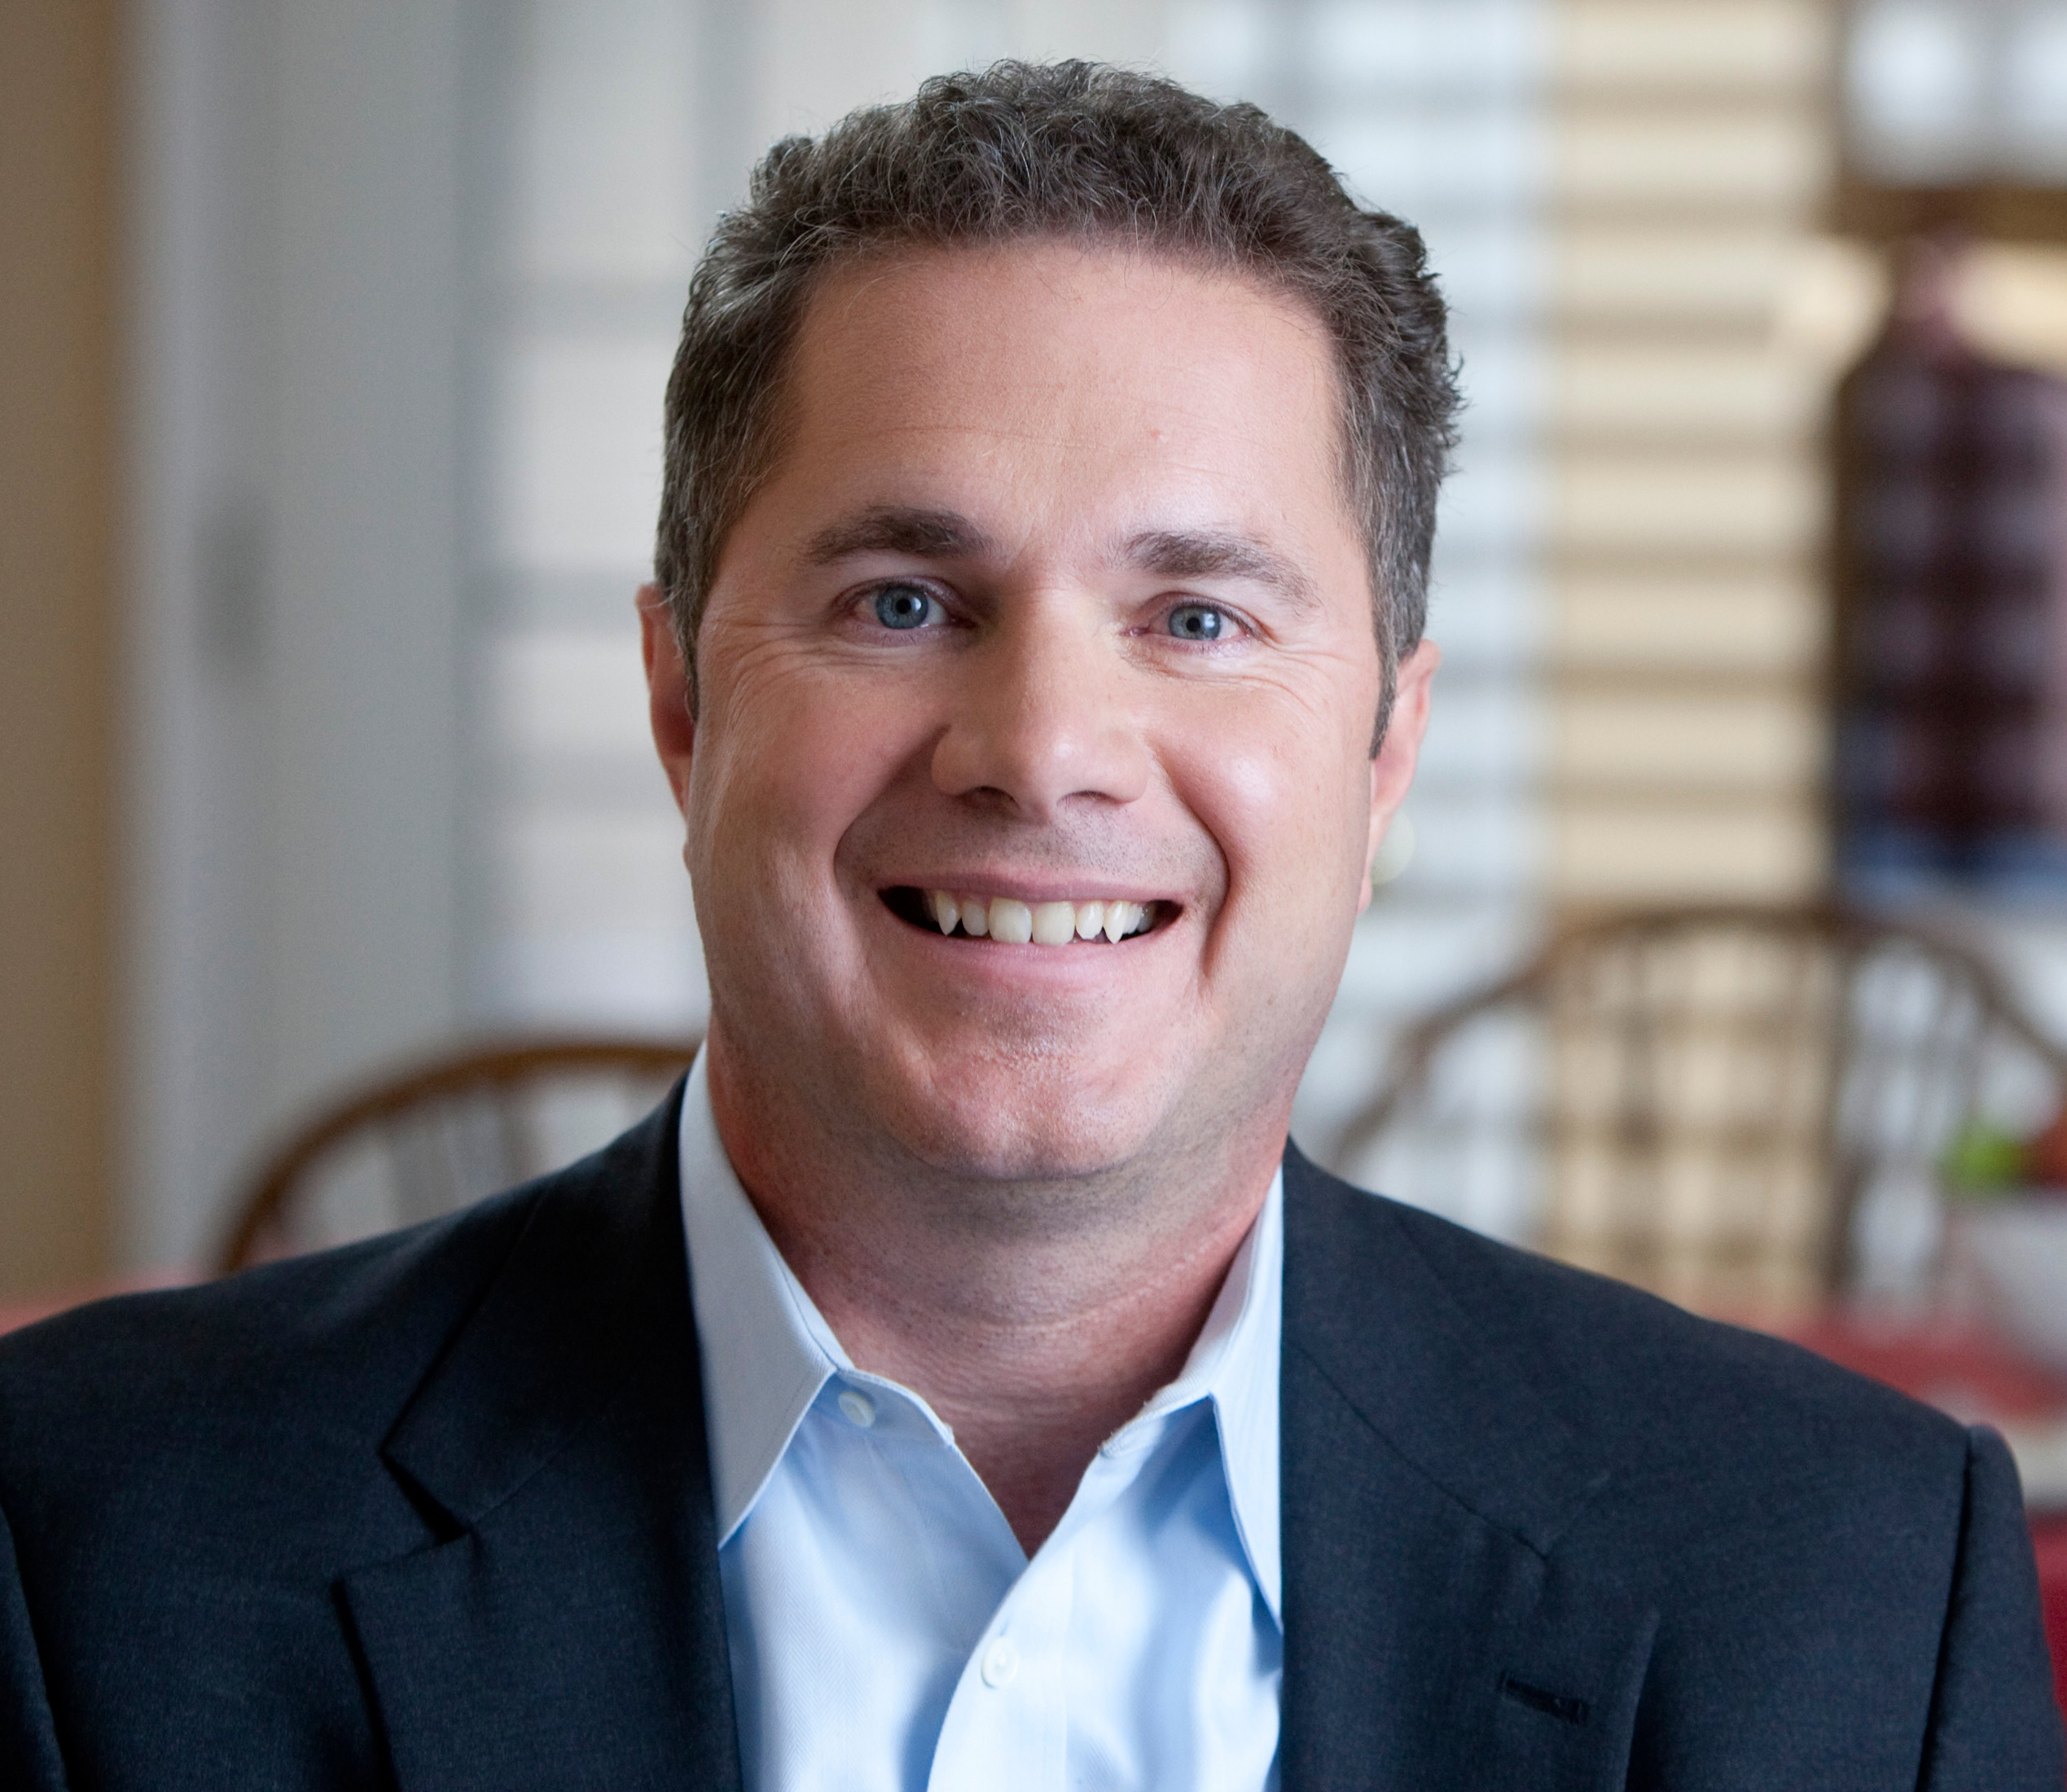
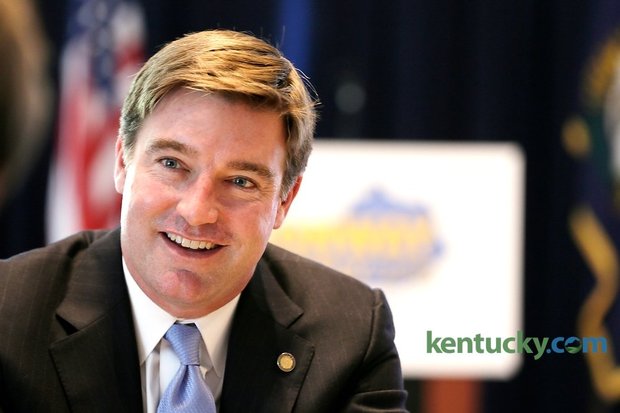
BRUCE BRALEY

Iowa has historically been a conservative state, often electing Republicans to Congress. In fact, in the entire history of Iowa, Iowans have sent 27 Republicans to the Senate, and only 11 Democrats. The Iowan delegation to the House of Representatives is not much different, 154 Republicans to 54 Democrats, with the Democrats usually serving far shorter terms. However, the recent trend indicates a far more purple political reality in Iowa. Democrats have made a fair amount of progress within the past few decades, with some districts turning blue and sending Democrats to Washington much more often than history would have us predict. This leads us to speculate whether the red wave of November 2014 was a bonafide partisan shift, or merely a product of temporary circumstance; attributable to the presidential party backlash almost always seen during a mid-term election cycle.

Braley-HR-Headshot

Bruce Braley was part of this recent Democrat progress, coming in with the wave of Democrats that were elected as the American financial sector was crumbling in 2006, beating out Republican Mike Whalen by a comfortable 12% margin (BallotPedia, 2014). Democrats have struggled to maintain this advantage after taking control of all three branches of government at the federal level, but due to the unpopularity of the Affordable Care Act, Republicans have now erased all of the aforementioned Democrat gains and more. Bruce Braley was one of the few new Democrats remaining in 2014; with “new Democrats” being defined as Democrats that came from otherwise conservative congressional districts that were only elected out of voter disdain for the Afghanistan and Iraq wars in the mid 2000’s. After all, Braley’s 1st Congressional District seat in the U.S. House had been controlled by Republicans for 89 of the previous 101 years prior to his first victory (Office of the Clerk, 2015). Perhaps it was that Braley underestimated current voter disdain President Obama and anyone that was a member of the Democratic Party. Braley was hanging onto his House seat in a historically very conservative district, but he assuredly did not have the prospect of Tom Harkin’s Senate seat locked down. However, the stars aligned and gave Braley arguably the best chance he would get to take this step up, presenting him with a mediocre Republican field and plenty of leftover 2012 campaign funds to take his shot.

Braley attended Iowa State University in his youth, and received his Juris Doctor from the University of Iowa College of Law. After this, he started his long career as a trial lawyer, and following his Senate campaign loss, now litigates full time once again. In the years leading up to 2014, he had taken steps to eventually prepare himself for the Senate. In 2006 Braley won his first campaign by a significant margin, 55.1% to 43.2%, after the 1st congressional district seat was vacated. He followed this up with another win, 64.6% to 35.4% in 2008, 49.5% to 47.5% in 2010, and 56.9% to 41.6% in 2012. His constituents had, for the most part, decisively (with the exception of 2010) chosen him to represent them. Fortunately for him, in his run for Senate in 2014, Braley faced no opposition in the primary (BallotPedia, 2014).

Polling long before the primaries, in 2013 and early 2014 steadily showed Braley with a decisive lead to the tune of 6%-12%. He had established name recognition, a proven campaign organization, and no challenge in the primary, which gave him an advantage over whoever his opposition would eventually be. Because of this, Braley only had to run a textbook campaign. There was no need to be inventive, to experiment with anything new, or for him to even begin running negative campaign advertisements about Ernst. With his early lead and plenty of campaign funds, he was comfortable going into the race. It wasn’t until Ernst had won the Republican primary, and her organization released a video of Braley making a questionable comment about farmers, that he began to lose ground. In early June, polls began to show Braley trailing Ernst as negative campaign ads flooded Iowans’ TVs. Braley’s advantageous position had been completely eliminated, and the status quo had been turned upon its head. A textbook campaign would no longer suffice, and he would find it necessary to resort to more incendiary campaign strategies, like negative ads about Ernst, to defend himself. Voters now had video evidence that Braley may not be who he claims to be, and the Braley campaign found it easier to defame Ernst rather than attempt to erase negative perceptions of Braley from the voters’ minds. This new foundation created a far more volatile campaign, and from June until Election Day, the race was a complete toss-up with practically each subsequent poll showing a different candidate in the lead (Real Clear Politics, 2014).

  Screen Shot 2015-05-03 at 3.39.03 PMSource: Real Clear Politics, 2014

The aforementioned “comment” was a remark he made about Iowa Senator Chuck Grassley, and this early misstep eroded much of the fundamental advantage he had going into the election. Braley hosted a fundraiser for his Senate campaign in January 2014, and invited fellow attorneys in an attempt to persuade them to donate to his cause. He cited his prospective appointment to the Senate Judiciary Committee, and his background in law; implying that he would ensure that the Senate didn’t pass any legislation that would be harmful to lawyers’ practice, saying, “If you help me win this race, you may have someone with your background, your experience, your voice … on the Senate Judiciary Committee. Or you might have a farmer from Iowa who never went to law school, never practiced law, serving as the next chair of the Senate Judiciary Committee.” A video of Braley making these comments was released by a conservative political action committee, America Rising, and his opposition ruthlessly capitalized on his poor choice of words for the entirety of the campaign. Despite apologizing to Senator Grassley and the public, Braley never recovered from this mishap (Lachman, 2014). Iowa has a massive amount of agricultural, and naturally a large population of farmers. Braley’s comment taken out of context looks like an obvious attack on farmers’ intelligence, when in fact it is clear that he meant that farmers don’t typically have an education in public law and the judicial process, and that an attorney would be better suited to serve on the Senate Judiciary Committee, which is a fair assertion to make. However, no amount of apologies would have erased the damage he had done to his campaign.

Braley’s obvious strength is the connections he has and his ability to fundraise. Money was of no shortage to him, and “At the end of 2013, Braley had more than $2.6 million in his campaign account,” (Sullivan, 2014). In total, Braley raised $12,082,748 for the campaign, with 77% coming from itemized and un-itemized individual contributions (Federal Election Commission, 2014). His early money put him in a great position to control how he wanted his campaign message to emerge, and to what magnitude he wanted his campaign to have a presence in Iowa early on. However, because of his Grassley comment, he was thrust into the spotlight much earlier than he had anticipated, and was forced to start burning money to erase the negative image voters had about him. In retrospect, it may be safe to say that he should’ve let the gaffe fizzle out and not spend money trying to refute what the opposition was saying, but this knee-jerk spending reaction can nonetheless be perceived as a reasonable course of action to have taken given the circumstances.

Screen Shot 2015-04-14 at 9.48.49 PMSource: Center for Responsive Politics, 2014

            As for outside spending, there was a total of $23,751,533 in money coming from outside the state that was spend on Bruce Braley, with $4,244,593 spent in support of him, and $18,841,528 opposed to him (Center for Responsive Politics, 2014).

JONI ERNST

Joni Ernst, Montgomery County native, attended Iowa State University and joined the National Guard after her graduation. She was deployed during the Iraq war in 2003 and led 150 other servicemen and women in Kuwait and Iraq as a Lieutenant Colonel (Ernst, 2015). These credentials helped to give her campaign something tangible for voters to rally around, and certainly bolstered her position relative to her opponent Bruce Braley. She won her seat in the Iowa State Senate in 2011 in a special election after the seat was vacated with an impressive 67.4% of the vote, spending $128,208 to win it. She was subsequently reelected in 2012 when she ran unopposed. Ernst has since served on various committees, which helped to build momentum behind her as a rising star in the Republican Party (Ballotpedia, 2014).

140929_POL_JoniErnst.jpg.CROP.promo-mediumlargeErnst faced a difficult Republican primary in the 2014 Senate race. There were five total contenders, and being a new face in the Iowa legislature, she didn’t necessarily have much to differentiate herself from the rest of the pack. Her competition was famous, qualified, and well funded. Among them were the former CEO of an energy company Mark Jacobs, the popular radio host Sam Clovis, the former U.S. Attorney Matt Whitaker, and Scott Schaben.

Ernst had largely trailed the pack until she released her famous “Squeal” advertisement in March of 2014 which was an instant success and received national attention due to the content of the commercial, in which she says “I can castrate pigs so I am the perfect conservative for Iowa to send to the Senate . . . I grew up castrating hogs on an Iowa farm. So when I get to Washington, I’ll know how to cut pork. Washington’s full of big spenders. Let’s make ’em squeal.” The voters loved the message, as Ernst perpetuated the state-versus-federal narrative that so many citizens enjoy hearing. This and one other clever commercial gave Ernst instant notoriety, and she led the polls until Election Day, ultimately winning with 56.2% of the vote (Ballotpedia, 2014).

Screen Shot 2015-05-03 at 3.01.22 PMSource: Real Clear Politics, 2014

Jacobs, overall, raised a staggering $3.1 million for the primary campaign; eclipsing the $1 million Ernst raised which is neither a small sum (Hohmann, 2014). Unfortunately for Mark Jacobs, his $3.1 million only bought him 16.8% of the vote. Clovis, despite raising only $282,000, ultimately came in second place with 18% of the vote share; no where close to Ernst’s impressive 56.2% (Hayworth, 2014). Matt Whitaker captured 7.5%, and Scott Schaben came out with 1.4% of the vote.

Immediately following her victory in the primary, Ernst’s backers began ruthlessly advertising Braley’s January gaffe. Negative campaigning was a central strategy employed by both camps during this race, but Ernst’s campaign used it far more; but this was largely because Braley gave them more material to use. Indeed, Ernst ran an airtight campaign, with no slip-ups that ever became heavily publicized. Braley had to resort to criticizing her for who was donating to her and her stances on issues. However, Braley was not wrong to lambast her on her political positions, as this was the only real Achilles heel of Ernst’s campaign; she holds very atypical views, far more inline with the Tea Party than the mainstream Republicans, even on issues where the people are in nearly universal agreement. Ernst supports repealing the federal minimum wage, disbanding the Department of Education, disbanding the Environmental Protection Agency, repealing the Clean Water Act, banning abortion, and much more (KCCI, 2014). For Braley and nearly any other candidate that has run a campaign, Ernst’s positions could be considered ripe to be taken advantage of and exploited to discredit her to the electorate.

The Affordable Care Act (ACA), one of the most salient political issues at the time, was addressed on several occasions, but mostly in TV advertisements. Braley supported the legislation as whole, but thought there was room for improvement. Ernst repeatedly called for the repeal of the Act and the dismantling of the state and federal exchanges (KCCI, 2014). Whether each candidate truly believed in the stances they took, we will never know, but each position did play to each base appropriately. Because the ACA was so divisive at the time of the election, the Braley campaign steered clear from initiating the debate on it. Every occasion that it was introduced as the topic of discussion was initiated by Ernst campaign, and rightfully so.

Despite their very clear positions on the main issues in contemporary American politics, issues are not what decided this election. Joni Ernst has an impressive natural charisma. She has a Clinton-like personality, insofar that she is likable, charming, and very pleasant to listen to if you are any average voter that is looking for reasons to like a candidate. Ernst possesses a personality characteristic that allows her to make a connection with voters on a personal level; something the Bruce Braley tended to lack when he needed it most. When you set aside the politics, she was just simply more likable, and had a personal touch that couldn’t be matched by Braley.

Additionally, Ernst showed promise in the fundraising realm, despite many having doubts that traditional conservatives throughout the country would throw their money behind a newcomer, and furthermore a newcomer that had such Tea Party reminiscent positions on the issues. Ernst raised a total of $12,011,101, with 80.1% coming from individual contributions, a very impressive feat. But, because she had a primary to deal with, by the time she reached the general election campaign she had already spent $461,206.00 (Federal Election Commission, 2014). This and Braley already having $2,600,000 in his war chest put Ernst at a disadvantage, and forced her to raise more money, and to make what money she had go further. There was a total of $37,544,557 in money coming from outside the state that was spent on Joni Ernst, with $12,244,939 in support of her, and $25,196,618 opposed to her (Center for Responsive Politics, 2014).

Screen Shot 2015-04-14 at 9.50.10 PMSource: Center for Responsive Politics, 2014

OUTCOME

A recurring theme in the Iowa Senate race was both sides accusing each other of receiving money from billionaires. For Braley, there were many advertisements that aired informing voters of Ernst’s ties with the billionaire Koch brothers. He called Ernst out on that personally during their debate when asked about renewable fuel standards, saying, “I’m not sure that’s what Senator Ernst told the Koch brothers when she went to their secret meetings.” From Ernst, there were countless advertisements telling voters that Braley had taken money from billionaire Tom Steyer, and she also personally called him out on it during their debate in response to Braley’s claim, saying, “You are being funded by Tom Steyer, who is a Californian billionaire extreme environmentalist,” (KCCI, 2014). All in all, this strategy for both sides was a zero-sum game, and it was not a wise strategy for Braley to employ. He should have known that Ernst could refute his point in the way that she did. Once Braley had made the original claim, Ernst’s hands were tied, and she was forced to call Braley out on his connection with Tom Steyer. Braley was the pot that called the kettle black.

Regardless of how effective of a legislator Bruce Braley was, the reality of his tenure as a U.S. Representative is that he was originally elected during the Democrat wave of 2006, in which the party picked up thirty-one seats in the House (The New York Times, 2006). Thus, if an unpopular President Bush got him elected, an unpopular President Obama certainly wasn’t helping his cause this go-around. Republicans have applied relentless pressure since the massive gains the Democrats made in 2006 and 2008, rooting out all of the new democrats that found a seat during the Great Recession. From this perspective, Bruce Braley actually held onto his seat far longer than many of his fellows that got the boot when the public revolted in 2010 and gave the Republicans sixty-three new House seats. If nothing else, the fact that Bruce Braley is the longest serving Democrat in the history of the Iowan 1st Congressional District (dating back to 1845) is proof enough that he has either represented his district extremely well, or that he exploited a temporary wave of liberal sentiment very well. Whatever the reason, the people in his district were happy with him being their representation in Washington D.C. for the better half of a decade.

Iowa is demographically one of the least diverse states in the nation. Whites comprise 88.3% of the population compared to 64.2% nationally, while Blacks account for just 3.0% compared with 12.2% nationally (County Health Rankings, 2015). Of the 3,074,186 people that live in Iowa, 2,142,304 are registered to vote as of November 2014, giving Iowa a 69.6% registration rate (Iowa Secretary of State, 2014). This actually puts Iowa in the better half of the country for voter registration rate, 13th, as of 2012 (Pew Charitable Trusts, 2014). As for turnout in 2014, the turnout in Iowa was 50.2%, 7th highest in the nation. This is likely attributable to not only the highly contested race, but also because Iowa allows for same-day voter registration (Nonprofit VOTE, 2015). There is no doubt that Iowa’s relatively high mid-term turnout helped Bruce Braley, and there is also no doubt that Iowa’s extremely low black population helped Joni Ernst. The lack of a diverse population is relatively unique to Iowa and few other states, and this is one metric that makes it more difficult for Democratic candidates to win in the state. Though to be fair, this demographic composition has obviously not been the source of any electoral trouble for Braley in years past.

Joni Ernst was also successful in turning the Iowa Senate race into an “Iowa versus Washington” race, and was arguably her central goal and campaign strategy. Ernst consistently returned to this theme, forcing Braley to spend his valuable time trying to refute the notion that he was a part of the inoperative Washington machine to the point of almost trying to convince voters that he wasn’t a member of Congress. Embodying this central strategy of Ernst’s is a statement she gave immediately after she won the primary, saying “This campaign will come down to a very simple choice: our shared Iowa values, versus Bruce Braley’s liberal Washington values,” (Politico, 2014).

CONCLUSION

The 2014 Iowa Senate race can be summarized as follows: Bruce Braley may have been the more experienced legislator, but Joni Ernst knew how to campaign better. This touches on an interesting phenomenon in political science; that it takes a different set of skills to get elected to legislate than it does to legislate, and because of this, sometimes individuals who aren’t suited for the actual work are the ones that win elections. Joni Ernst was better able to connect with the voters by simplifying the issues down to digestible chunks of information. She’s charismatic and influential. Bruce Braley seems to have an outstanding grasp on the specifics of the issues and a more mainstream average position on the current issues that matter and issues Ernst created, but seemed standoffish and un-relatable enough to make voters remember him for it.

Braley may not have been able to survive the “red tide” no matter what happened, but the quality of his campaign in contrast to Ernst’s certainly made it impossible. Ernst turned Braley into an outsider, and convinced voters that he was completely disconnected with the reality of their shared condition.

-Tyler

REFERENCES

BallotPedia. (2014). Bruce Braley. Retrieved April 11, 2015, from BallotPedia: http://ballotpedia.org/Bruce_Braley

Ballotpedia. (2014, November). Joni Ernst. Retrieved April 14, 2015, from Ballotpedia: http://ballotpedia.org/Joni_Ernst

Center for Responsive Politics. (2014, November). Rep. Bruce Braley. Retrieved April 12, 2015, from OpenSecrets.org: https://www.opensecrets.org/politicians/industries.php?cycle=2014&cid=N00027464

County Health Rankings. (2015). 2015 Iowa Summary Report. University of Wisconsin. Madison: County Health Rankings.

Ernst, J. (2015, January). About Joni. Retrieved April 14, 2015, from Joni Ernst – United States Senator: http://www.ernst.senate.gov/content/about-joni

Federal Election Commission. (2014, November). Details for Candidate ID: S4IA00087. Retrieved April 12, 2015, from Federal Election Commission: http://fec.gov/fecviewer/CandidateCommitteeDetail.do

Hayworth, B. (2014, June 4). Clovis Looks Back on Iowa Primary Loss. Retrieved May 2, 2015, from Sioux City Journal: http://siouxcityjournal.com/news/local/a1/clovis-looks-back-on-iowa-primary-loss/

Hohmann. (2014, June 3). Joni Ernst wins Iowa GOP Senate Primary. Retrieved May 3, 2015, from Politico: http://www.politico.com/story/2014/06/joni-ernst-iowa-gop-senate-primary-2014-elections-bruce-braley-107401.html

Iowa Secretary of State. (2014). State of Iowa Voter Registration Totals. Des Moines: State of Iowa.

KCCI. (2014, September 28). Iowa U.S. Senate Debate. Retrieved April 7, 2015, from Youtube: https://www.youtube.com/watch?v=NOUodSNyZtg

Lachman, S. (2014, March 26). Bruce Braley Faces Harsh Criticism In Iowa Over Farmer Comments. Retrieved April 11, 2015, from Huffington Post: http://www.huffingtonpost.com/2014/03/26/bruce-braley-iowa_n_5034847.html

Nonprofit VOTE. (2015). America Goes to the Polls 2014. Nonprofit VOTE.

Office of the Clerk. (2015). Election Statistics. Retrieved May 3, 2015, from Office of the Clerk – U.S. House of Representatives: http://clerk.house.gov/member_info/electioninfo/index.aspx

Pew Charitable Trusts. (2014, April 8). Elections Performance Index. Retrieved April 12, 2015, from Pew Trusts: http://www.pewtrusts.org/en/multimedia/data-visualizations/2014/elections-performance-index#state-IA

Politico. (2014, June 3). Joni Ernst wins Iowa GOP Senate Primary. Retrieved April 10, 2015, from Politico: http://www.politico.com/story/2014/06/joni-ernst-iowa-gop-senate-primary-2014-elections-bruce-braley-107401.html

Real Clear Politics. (2014, Novmeber 4). Iowa Senate – Ernst vs. Braley. Retrieved April 11, 2015, from Real Clear Politics: http://www.realclearpolitics.com/epolls/2014/senate/ia/iowa_senate_ernst_vs_braley-3990.html

Sullivan, S. (2014, April 3). Bruce Braley’s bad week. Retrieved April 11, 2015, from The Washington Post: http://www.washingtonpost.com/blogs/the-fix/wp/2014/04/03/how-angry-farmers-could-help-the-gop-win-back-the-senate/

The New York Times. (2006, November 4). 2006 Election Guide. Retrieved April 10, 2015, from The New York Times: http://www.nytimes.com/ref/washington/2006ELECTIONGUIDE.html

THE UNINSURED VOTE FOR REPUBLICANS

Note: This research only considers the 2014 Senate election in the state of Iowa

For nearly a century, Democrats far and wide have called for government provided healthcare to varying degrees. The first of these policies that were eventually passed by Congress were Medicare and Medicaid, which have been largely successful in accomplishing what they sought to accomplish: minimizing or eliminating healthcare expense for the elderly and for the poor. Since then, major healthcare reform has been a talking point in virtually every Congress, but has failed to make any substantive progress; with the exception of the current administration that, five years ago, passed the Affordable Care Act (ACA).

The ACA has been the source of a very contentious debate about the role of government in our society, and whether we have experienced an infringement on our individual liberty when submitting to the requirements of the new law that force every individual to have health insurance in some capacity. The new law, in conjunction with the Medicaid expansion that extended Medicaid qualification to a much larger segment of the population, also made health insurance affordable or free to a large number of Americans; finally bringing the prospect of health insurance into the realm of possibility for many families that had never thought it possible before.

But do Americans value the idea of health insurance? Is it important to most people? And if so, do most Americans associate the idea of healthcare accessibility with the Democratic Party? These are the questions this study seeks to answer. It is hypothesized that citizens who are uninsured value health insurance, and are more likely to vote for the Democratic Party in order to ensure that health insurance becomes more accessible to them either through the legal framework or for financial reasons.

To answer this question, data was obtained from the County Health Rankings website for the state of Iowa. This yearly publication has a multitude of health and demographic variables that this organization combines and weights accordingly to produce a ranking for each county. Refer to the below section for the identification of variables used as well as their definition. Voting data was also obtained through the office of the Iowa Secretary of State for the 2014 Senate election for every county in Iowa and for every candidate in the race including write-in votes. This data was paired with the previously mentioned data for each county, and a regression analysis was performed using several different models.

EMPIRICAL METHODS AND THEORY

The central hypothesis of this study is specified as follows:

 H1: People who are uninsured are more likely to vote Democrat because an integral component of the national Democrat platform is healthcare accessibility.

The overall theorized model of the analysis is specified by the following multiple regression equation:

 %VoteDem = β0 + β1 %Uninsured + β2 %Unemployed – β3 %Over65 + β4 %Black + β5 %VoterTurnout – β6 MedianIncome + ε

Where:

 %VoteDemocrat is the percentage of votes that were cast for the Democratic Party’s candidate Bruce Braley in the 2014 Iowa Senate election.

%Uninsured is the percentage of the population by county under the age of 65 that does not have health insurance.

%Unemployed is the unemployment rate by county.

%Over65 is the percentage of the county’s population that is over 65 years of age.

%Black is the percentage of the county’s population that is African American.

%VoterTurnout is the percentage of county’s population that voted in the election.

MedianIncome is the median income of the county.

All of these variables are founded in the theory behind this research, and all corroborate with historically held beliefs and empirical findings regarding American elections. First, unemployed citizens are one of the most reliable parts of the electorate for Democratic candidates. The Democratic platform consistently pushes greater benefits for the unemployed, which is one of the larger components of the at-large social safety net of the United States. This could have developed into a self-fulfilling prophecy since Franklin Roosevelt enacted the first unemployment programs in the early 1930’s, as Democratic candidates came to find that the unemployed almost always voted for them. Thus perhaps it is the case that Democrat politicians seek to expand unemployment benefits to reinforce the support of the unemployed for the party, and the unemployed continue to support the Democratic Party because they foresee an expansion to their unemployment benefits. This is an interesting thought-experiment, but for the purposes of this study it is only important to bear in mind that the unemployed consistently vote Democrat, and this is why the theorized equation has a positive β2.

It is well known and documented that the elderly, members of the “Silent Generation,” have overwhelmingly voted Republican during the last decade. The Silent Generation is “the generation that is most strongly disapproving of Barack Obama,” and “was once the most Democratic [generation], but is now the most Republican,” (Pew Research Center, 2011). For this reason, the elderly composition of each Iowan county can be controlled for, which will help to explain variability in the Democrat vote. Because it is known that the elderly vote Republican, the theorized equation has a negative β3. On that same note, Blacks have been one of the most reliable demographics for Democrat support since the Civil Rights Movement of the 1960’s, and in some places for longer than that. This is why the regression equation has a positive β4.

The income variable is theorized to have a negative coefficient because it is suspected that wealthier places tend to vote Republican, for essentially the same reasons that it was explained that the unemployed vote for Democrats. Democrats tend to have platforms that benefit the poor and lower classes, and frequently rely on them to mobilize to win elections. Also, it is documented that, nominally, there are more citizens that self-identify as Democrats in the United States than Republicans, though this statistic takes an unusual turn when more identify as conservative than liberal. This is the reason that Democrat candidates place more emphasis on voter mobilization efforts, as the very voters they count on to win the election are typically the same voters that fail to show up to vote. Thus, the turnout variable has a positive coefficient; meaning that greater turnout will benefit the Democrat Party.

DISCUSSION

After running the aforementioned regression an ensuring control for heteroscedasticity in Stata, we are presented with some incredibly interesting results:

Screen Shot 2015-05-08 at 11.15.27 PM

The results from Stata largely confirm the hypothesized effects of each variable, except for the one we are specifically looking at: the percentage of uninsured. These results indicate, with a statistically significant p-value of 0.075 in the complete model, that the greater the percentage of uninsured, the less votes the democratic candidate received. This means that, while we are controlling for many other factors, uninsured citizens tended to vote for the Republican candidate in the 2014 Senate election in Iowa, Joni Ernst. Bear in mind that Joni Ernst was the candidate that was staunchly opposed to the Affordable Care Act, and by logical extension, expanded healthcare access and accessible health insurance for those that had none. Note that in Model 1, the adjusted R2 is only 0.016, meaning that the idea of being uninsured or not only explained 1.6% of the variability in the voting percentage for the Democrat candidate. This means that being uninsured means virtually nothing in the context of elections, but when it does matter the voter will be more likely to vote for the Republican than for the Democrat. What a bizarre finding.

As theorized, the results confirm that the unemployed and black voters strongly voted for the Democrat candidate, and the elderly and the wealthy tended to vote for the Republican candidate. Voter turnout also had a positive effect on Democrat vote.

Screen Shot 2015-05-08 at 11.16.11 PM

After generating a correlation matrix, we are confident that we have no problems with multicollinearity in the model. The greatest correlation among variables is the relationship between unemployed and income, -0.601, but this is to be expected and the correlation is not necessarily high enough that it should be a cause for worry.

CONCLUSION

Though the findings of this model and analysis are interesting, we must be very careful in holding any of these results as truth. The adjusted R2 is only 0.487, which means that there are other variables lurking somewhere that would explain the other 51.3% of the variance in why people voted for Democrat candidate Bruce Braley in the 2014 Iowa Senate election. This model largely reinforced previous research that has shown time and time again that the elderly and wealthy vote for Republicans, and blacks and unemployed vote for Democrats. The idea of uninsured people voting for the candidate that would instill further legal roadblocks in their way of getting health insurance is bizarre; but if one considers the type of people that still do not have health insurance through the ACA, perhaps one may find some answers. Whatever the hypothesized reason, to prove that the uninsured do not value the prospect of health insurance and do not vote for Democrats because of that, this claim needs far more research; research that uses data over time and data nationwide.

Hope you enjoyed,

Tyler

WORKS CITED

Iowa Secretary of State. (2014, November). Elections Results and Statistics. Retrieved from Iowa Secretary of State: https://sos.iowa.gov/elections/results/index.html

Pew Research Center. (2011, Nov 3). The Generation Gap and the 2012 Election. Retrieved March 28, 2015, from http://www.people-press.org/2011/11/03/the-generation-gap-and-the-2012-election-3/

University of Wisconsin – Population Health Institute. (2015, January 1). 2015 Iowa Summary Report. Retrieved from County Health Rankings: http://www.countyhealthrankings.org/app/iowa/2015/overview

DO VOTERS HOLD THE PRESIDENT AND GOVERNORS ACCOUNTABLE TO ECONOMIC PERFORMANCE? NOT REALLY.

INTRODUCTION

There are a multitude of factors that dictate how someone votes in an election, and for a large share of individuals, whether they even vote at all. Political Science has a long history of attempting to define which characteristics influence the electorate to vote for a particular party; sometimes for academic purposes, but in the election industry, these defining characteristics are very valuable information.

There are internal factors and external factors that decide an individual’s vote. Internal factors are characteristics inherent to the person that increases their predisposition to vote for a particular political party, e.g. race, sex, or age. External factors are things that occur out in society that influence an individual’s political leanings, e.g. the salience of a social issue at the time of the election, economic growth or shrinkage, or the response of an administration to a national security threat. The effects of these events on the electorate are more difficult to quantify, but that is the aim of this paper, at least for one specific type of external factor: economic growth.

Do voters hold government officials, more specifically executives, accountable to economic performance during their tenure? What about the party of the executive; do voters punish the political party of the executive when economic performance is poor and reward it when it exceeds expectations? At first the answer seems like an obvious one. In fact, if there were any factor that did dictate the electorate’s vote, it would seem that most would say economic performance was it. But, the interesting part of this lies in the specifics, and implications of the question. If it is found that economic performance has little to no bearing on the electorate’s aggregate vote for the political party that is in power at the executive level, then this would indicate that voters do not make their decision in the context of political parties. Perhaps it would mean that they place more emphasis on the personal characteristics of the candidate. Alternatively, it could indicate that the partisan divide is so strong that voters, on the aggregate level, vote on party lines despite how good or bad the perceived economic leadership of the president or governor is during their tenure. And lastly, it could even indicate that campaigns are so effective at pushing a specific narrative that voters forget the reality of economic conditions.

But what results do you get when you examine the relationship between state economic conditions and presidential vote share? Do voters hold the president’s party accountable, and furthermore do they hold the president’s party accountable for state economic conditions that are outside of the national government’s control? In this paper we will discover whether or not a relationship exists, and determine whether or not accountability stays in its appropriate sphere. Building on this as well, we can make some determinations of other factors that affect presidential and gubernatorial success in elections.

RELEVANT RESEARCH

            Nearly every publication in political science regarding this subject looks at election results through the lens of two different voting behavior models. The first is the national referendum model, which “suggests that voters in subpresidential elections express their approval or disapproval of the sitting president and his policies with their vote.” The other model is the economic voting hypothesis, which “suggests that voters in these elections express support or dissent for the performance of the incumbent based upon how well the economy is doing,” (Atkeson and Partin, 1995). At its core, this last model indicates that voters who are financially better off than they were before the candidate took office will reward the incumbent, and conversely will punish them if that does not hold true. The economic voting hypothesis is what we are primarily taking a look at here, with a couple of variables that would shed some meaningful light on the applicability of the national referendum model in the gubernatorial analysis.

Institutions, The Economy, and the Dynamics of State Elections takes a deep look into the aforementioned topic at the state legislative and gubernatorial levels (Chubb, 1984). Chubb considers the relative effects of presidential coattails, the common backlash against the party of the president during mid-term elections, and state and national economic conditions. He believes that “. . . when it comes to assigning responsibility for economic performance, state voters have generally and increasingly looked outside of the state to the national economy and the president’s imputed performance in managing it,” thus a poorly performing national economy would influence the outcome of a state election, despite a state’s hypothetical independently strong economic performance. The analysis of this paper has shown Chubb’s claim to be inconsistent with voting behavior in the last two decades, but perhaps there has been a genuine change in behavior between the time period he analyzed and now. Lastly, Chubb says that at the state level, “the factors that account for variations in normal partisan voting across the states include idiosyncrasies of culture and history that subvert general explanations,” which corroborates the findings of the analysis here. Gubernatorial electoral outcomes are the product of far more variables than presidential electoral outcomes.

James King, of the University of Wyoming, in 2001 performed a similar analysis in his publication titled Incumbent Popularity and Vote Choice in Gubernatorial Elections. Studying gubernatorial elections in four states, his results found that “. . . voters use the ballot for governor to express approval or disapproval of current economic conditions and the president’s job performance, or as an easy means of evaluating candidates.” This would square with Chubb’s publication that retrospective economic voting is a reality, and that voters hold the governor accountable to state economic performance.

Atkeson and Partin, in Economic and Referendum Voting: A Comparison of Gubernatorial and Senatorial Elections come to similar conclusions. They find that “. . . governors, as chief executives of their respective states, are held responsible for the health of their state economies and are not generally shown to be liable for fluctuations in presidential approval.” This further affirms the existence of economic retrospective voting at the gubernatorial level. Atkeson and Partin also “. . . find something of an in-party incumbency effect whereby incumbent governors of the president’s party suffer more from a perceived worsening of state economic conditions than incumbents of the out party,” and finally they claim, “. . . governors . . . escape from these national-level evaluations of presidential performance and are instead held liable for state economic conditions.” This would suggest that national economic performance has no bearing on governors, regardless of political affiliation.

In a very interesting article written by Robert M. Stein in 1990, the argument is made that economic conditions affect presidential vote share, but not gubernatorial, saying “. . . state and local incumbents are less likely to be affected by voters’ retrospective economic evaluations than their national counterparts.” Stein’s usage of the word “incumbents” would indicate that voters do not punish or reward the incumbent party when an incumbent is term limited and the election is open-seat. Stein’s findings do confirm his aforementioned hypothesis, and he goes on to state that “Voters hold their governor neither responsible nor accountable for the state’s economic conditions and their voting behavior reflects this perception . . . This evidence of economic voting for governor, however, varies with the partisan affiliation of the incumbent candidate,” thus when economic effects do matter in an election, voters will punish or reward each party by different amounts for the same economic performance. Stein’s research shows that voters differentiate between the impact state and federal policies can have on their personal finances, wrapping up his article by saying that “voters recognize that their personal financial condition is more closely tied to federal policies and actions than to the state’s,” (Stein, 1990).

A different approach to testing the executive economic accountability theory is taken by David Samuels and Timothy Hellwig. They cited the controversy of trying to define the dependent variable in the accountability model; whether to measure accountability as number of seats in a legislature swings in vote share of an incumbent, or in its most stringent sense, partisan control of the office in question. They found that accountability can be observed when measuring it as seats in a legislature or vote share of an incumbent, saying “When we conceive accountability in terms of sensitivity of swings in incumbent vote shares . . . and when we use seats as the dependent variable, we find that incumbent performance is sensitive to economic performance.” However, when measuring accountability as partisan control of the office, the results were inconclusive, saying “. . . when we conceive of accountability as partisan control over government . . . our findings temper Cheibub and Przeworski’s (1999) pessimism.” The authors ultimate conclude that “citizen control of politicians is . . . imperfect because particular political contexts limit voters’ ability to hold incumbents to account by obscuring responsibility for economic performance,” (Samuels & Timothy, 2010).

Johnson and Ryu look to other countries to test these models, but with the inclusion of broken campaign promises in the analysis. They sought to determine if economic performance, broken promises, or some combination of the two were what voters cared most about in executive elections. Their findings indicated that neither of the two factors had any substantive effect alone, but an interaction between both variables resulted in statistically significant results, going on to say that “the relationship between broken campaign promises and incumbent vote change is affected by economic conditions.” This means that regardless of economic performance, as long as no campaign promise was broken, the executive was not rewarded nor were they punished for it; and alternatively, when a campaign promise was broken, voters held the executive accountable for economic performance, likely due to increased scrutiny (Johnson & Ryu, 2007).

METHODOLOGY

Data was gathered from official and private sources (deferring to official whenever possible), from the years 1987 to 2013.

The hypothesis for the state level is as follows:

 State Level H1: People vote to retain the governor, or party of the governor when he/she is term limited, when the state in question experiences strong economic growth.

State Level H2: On average, a governor will be positively affected when the governor is the same political party as the sitting president and their elections coincide.

The overall theorized model of the analysis is specified by the following regression equation:

 %VoteShareGovParty = β0 + β1 % StateGrowth + β2 % NationalGrowthSamePres – β3 %NationalGrowthOppPres + β4 PartisanControl + β5 GovIsIncumbent + β6 GovSamePartyElectionasPres + ε

The following are variable definitions:

%VoteShareGovParty: The percentage of vote share received by the party of the incumbent governor, whether the governor was running for reelection or not.

%StateGrowth: Measured as the percentage change in Per Capita Real Gross State Product over the tenure of the governor.

%NationalGrowthSamePres: An interaction between a dummy variable that turns on when a governor is the same party as the president, and the percentage change in Real Gross Domestic Product

%NationalGrowthOppPres: An interaction between a dummy variable that turns on when a governor is the opposite party as the president, and the percentage change in Real Gross Domestic Product

PartisanControl: Serves as a baseline for the predicted vote share of a governor. This is measured by taking the average of the vote share of the Democrat Party for every gubernatorial election between 1987 and 2013, and providing that number if the incumbent party is Democrat, or 100 minus that number if the Incumbent party is Republican. The coefficient of this variable will be difficult to interpret, and is not meaningful for our sake.

GovIsIncumbent: This is a dummy variable that turns on if the governor is an incumbent.

GovSamePartyElectionasPres: This is a dummy variable that turns on if the governor is the same party as the president, and their elections fall on the same year.

Gubernatorial election results and information on gubernatorial incumbency were aggregated from Wikipedia, which has curated lists that source the data from each state’s secretary of state or equivalent. I am aware that Wikipedia is frowned on to use as a source in an academic context, but there was simply no other source that had the data in a remotely useful format. National RDGP growth, as well as state per capita RGDP growth figures were obtained from the Bureau of Economic Analysis. The rest of the variables were computed through Excel functions to prepare the dataset. Observations were discarded if the incumbent party was not Democrat or Republican, and after the completion of the dataset, there were 327 total observations being analyzed. For the regression analysis, Stata 14 was used.

The national level model is much the same, with two hypotheses as well:

National H3: People vote to retain the president, or party of the president when he is term limited, when the country as a whole experiences strong economic growth.

National H4: People vote to retain the president, or party of the president when he is term limited, when their state experiences strong economic growth.

The overall theorized model of the analysis is specified by the following regression equation:

%VoteSharePresParty = β0 + β1 % StateGrowth + β2 % NationalGrowth + β3 PartisanControl + β4 PresIsIncumbent + ε

The following are variable definitions:

%VoteSharePresParty: The percentage of vote share received by the party of the incumbent president, whether the president was running for reelection or not.

%StateGrowth: Measured as the percentage change in Per Capita Real Gross State Product over the previous presidential term.

%NationalGrowth: Measured as the percentage change in Real Gross Domestic Product

PartisanControl: Serves as a baseline for the predicted vote share of a president. This is measured by taking the average of the vote share of the Democrat Party for every presidential election between 1987 and 2013 and for every state, and providing that number if the incumbent party is Democrat, or 100 minus that number if the Incumbent party is Republican. Like the gubernatorial model, the coefficient of this variable will be difficult to interpret, and is not meaningful for our sake.

PresIsIncumbent: This is a dummy variable that turns on if the president is an incumbent.

Presidential election results and incumbency information were aggregated from The American Presidency Project. National RDGP growth, as well as state per capita RGDP growth figures were obtained from the Bureau of Economic Analysis. The partisan control variable was computed through excel functions. Observations were adjusted if there was a third party candidate to exclude that impact on the results.

DISCUSSION

Screen Shot 2015-05-07 at 8.27.16 PM

After running the regression analysis on the data and ensuring that there were no omitted variables, we are presented with some very interesting results. Three different models were created for the gubernatorial level, with each subsequent model adding controls in an attempt to isolate the real effects that state GDP growth and national GDP growth have on the vote share for the political party that is in power at the executive level in state government. Though no heteroscedastic problems were foreseen, every model was controlled for heteroscedasticity by using the robust command in Stata. Refer to Table 1 for the results of all three models.

Screen Shot 2015-05-07 at 8.27.06 PM

After producing a correlation matrix, we find no possible issues with multicollinearity in the model. Notice the low correlation between the PartisanControl variable and %VoteShareGovParty. The PartisanControl variable takes historical voting averages for the Democrat Party in each state and uses that number as a baseline to predict vote share in the year in question. However, because aggregate state partisanship is much more volatile than the country as whole, and is susceptible to much quicker political ideology shift, historical voting averages are not nearly as good of a baseline at the state level as they are for the national level. In an ideal world, this correlation number would be equal to 1.000, which would allow us to perfectly predict the outcome of each election with only one piece of data, but unfortunately this is not the case. As you will soon see, the presidential model correlation between these two variables was much higher, leading to a much more accurate model.

Neither state nor national economic performance has any effect on gubernatorial vote, and we cannot accept H1. The closest either variable gets to any significance is with a p-value of 0.102, but even this is in Model 1 when the other controls are not active. This is a surprising result, and though the p-values for the state, same-party-national and different-party-national variables are 0.335, 0.995 and 0.736 respectively in the complete model, the R2 is 0.429. This means that there are other variables out there that will account for the other 57.1% of the variance in vote share for the political party in power. If those were controlled for, there is a chance that state and national economic performance could come back down into significance. However, the challenge with this is that there is no shortage of unobservable variables that have some bearing on the outcomes of elections.

To those familiar with the field of Political Science, it should come as no surprise that incumbents enjoy a tremendous advantage over their opponents. In this analysis, it was found that, when controlling for the other previously mentioned variables, simply being an incumbent gives a gubernatorial candidate a 10.646% (though we must consider the constant forces us to start below zero, at -3.343, so it’s not exactly 10.646 but rather a touch below) vote share boost; with a p-value of 0.000. This is also an underestimate, due to some states only requiring a plurality of the vote to win the governorship; e.g. some gubernatorial results in this data show a governor winning with as little as approximately 40% of the vote. These observations could have been removed, but they comprised a significant portion of the data, and incumbency advantage was not the aim of this research.

Presidential coattails were also confirmed by this analysis, for better or for worse. When a governor shared the same political party as the incumbent president and their elections coincided, the governor enjoyed a modest vote share boost; with a p-value of 0.003, allowing us to accept our H2. This could be attributed to the president running a hard fought campaign during his election year, in an attempt to increase his approval rating before Election Day; and when the incumbent president could not run for reelection, perhaps those conditions did not necessarily hurt a same-party governor either. Presidential campaign efforts, on average, apparently have a positive effect on not only his party members at the federal level but governors as well. This may no longer be the case today, but on average from 1987 to 2013, it was.

These results call into question the rationality of the votes cast in gubernatorial elections, and force us to ask ourselves, if these results are an accurate representation of reality, why voters do not hold governors and their political party accountable to state economic performance? Perhaps this is a result of state economic conditions being to some extent a product of the national economy, and also a result of state economic conditions being vaguely defined in the context of the bigger national picture. Rarely are voters exposed to economic performance data, and when they are it is highly unusual to be state data. However, even this does not square with voters not being mindful of national economic performance either. There is a chance that voters view the governor as isolated from any decisions that would affect the state economy and insulated from decisions that affect the national economy, and because of this, state and national economic conditions do not hold any bearing on their vote in gubernatorial elections.

Screen Shot 2015-05-07 at 8.27.40 PM

The presidential model produces far more predictable results. Three different models were created for the presidential level as well, with each subsequent model adding controls in an attempt to isolate the real effects that state GDP growth and national GDP growth have on the vote share for the political party that is in power at the executive level in the federal government. State economic growth is not significant in the complete model, however, and has a p-value of 0.918; preventing us from accepting H4 that hypothesizes that state growth has a positive impact on presidential vote share. Unlike the gubernatorial results that showed that state economic performance had no effect on general election outcomes, the president’s party is indeed accountable to national economic performance, with a p-value of 0.000; allowing us to accept our H3. Like the gubernatorial model, incumbency matters. Simply being an incumbent resulted in a significant vote share boost for the incumbent president.

Screen Shot 2015-05-07 at 8.27.32 PM

After producing a correlation matrix, we find no possible issues with multicollinearity in the model. The PartisanControl variable correlates highly with %VoteSharePresParty, 0.8909, but this is to be expected. In these models we are using voting averages for the Democrat Party in years past to estimate current Democrat vote share. What this means is that we seek a high correlation with the PartisanControl variable, and if it were not correlated highly this would mean that partisan trends and a state’s propensity to vote more for a specific political party were non-existent. We know this is false.

Perhaps most interesting is the performance of the included quadratic national GDP growth variable. The inclusion of this variable is only due to the very high level of significance it attained, and it admittedly makes little theoretical sense within the context of the model. Because OLS has estimated a negative coefficient, this indicates that GDP growth has a diminishing effect with respect to vote share of the incumbent party of the president, to the extent that at a certain point, higher growth actually reduces it. Theoretically, voters are eager to kick out the party in leadership when there is very low GDP growth. Voters are eager to retain the party in leadership when there is a satisfactory amount of growth. And lastly, perhaps voters are enjoying an economic prosperity so much with very high GDP growth that they don’t care to turnout for an election and keep their favored party in power.

The performance of the presidential model squares with the economic voting hypothesis. Voters notice economic growth (or the lack thereof) and attribute this to the performance of the president. Though the president has no constitutional basis to manage the national economy, voters have given this responsibility to him.

The gubernatorial model does not square with the economic voting hypothesis. Governors are not beholden to any economic performance. However, the model does square with the national referendum hypothesis, as evident in the statistical significance of the “Governor Same Party as President” variable. Voters express their discontent or satisfaction with the sitting president by voting against or for same-party governors.

CONCLUSION

Though these results indicate that economic performance holds little significance in the context of elections in modern times, this may not have always been the case. There is a stark juxtaposition between the strong anti-federalist sentiment of the 19th century, and today’s interconnected and unified country. Voters 150 years ago placed much more emphasis on state-level government and politics, and this is just simply not the case anymore. There is a (nearly) century long trend of giving more and more state power to the national government, and I believe that in this, the significance of state level economic performance has been largely lost. However, this is not to say that this trend will continue, or that the results of this analysis will even hold true in the future. Perhaps we are yet to witness the imminent state politics renaissance, but for now, economic performance doesn’t matter for governors.

Hope you all enjoyed,

-Tyler


REFERENCES

Atkeson, L. R., & Partin, R. W. (1995). Economic and Referendum Voting: A Comparison of Gubernatorial and Senatorial Elections . American Political Science Review , 89 (1), 99-107.

Chubb, J. E. (1988). Institutions, the Economy, and the Dynamics of State Elections. American Political Science Review , 82 (1), 133-154.

Johnson, G. B., & Ryu, S.-R. (2007). Campaign Promises, Economic Performance, and Electoral Accountability in Latin America . Annual Meeting of the American Political Science Association, (pp. 1-23). Chicago.

King, J. D. (2001). Incumbent Popularity and Vote Choice in Gubernatorial Elections. The Journal of Politics , 63 (2), 585-597.

Samuels, D., & Timothy, H. (2010). Elections and Accountability for the Economy: A Conceptual and Empirical Reassessment. Journal of Elections, Public Opinion and Parties , 20 (4), 393-419.

Stein, R. M. (1990). Economic Voting for Governor. Journal of Politics , 52 (1), 30-53.

U.S. Department of Commerce. (2015, April). Regional Data. Retrieved April 20, 2015, from Bureau of Economic Analysis: http://www.bea.gov

Wikipedia. (2014, December 2). United States gubernatorial elections, 1990. Retrieved

April 15, 2015, from Wikipedia:http://en.wikipedia.org/wiki/United_States_gubernatorial_elections,_1990

Woolley, J. T., & Peters, G. (2015). Presidential Elections Data. Retrieved April 1, 2015, from The American Presidency Project:http://www.presidency.ucsb.edu/elections

KENTUCKY’S NEXT GOVERNOR

To the average Kentuckian, the governor’s race has barely even started; but to those familiar with Kentucky politics, the race began long ago. During his time as Kentucky’s Attorney General, some may argue that Jack Conway has been strategically picking his battles in order to position himself politically for the battle for governor in 2015. On the other side of the aisle, Agriculture Commissioner James Comer has been an unstoppable political force ever since he cleaned house in the Department of Agriculture after former secretary Richie Farmer’s chaos. Meanwhile, businessman Hal Heiner has been flooding the media markets with cash long before any other candidate stepped into the arena. Tea Party candidate Matt Bevin is enjoying the name recognition he established in his Senate campaign last year. Several candidates are poised to win this November, and Kentuckians will have the opportunity to watch vicious campaigning from both sides, as this is a remarkably evenly matched field of candidates. Several of these candidates have a great deal of political momentum by any measure, and have spent years meticulously preparing for this campaign; but, unfortunately for them, only one can win. The losers are sure to suffer a blow to their political career, negatively affecting any future prospects of political office. But who will come out on top?

THE REPUBLICAN FIELD

Although James Comer is the front-runner on the Republican side, the field is still littered with opposition that he will have to campaign strongly against before he gets a chance to face Conway. The first of these candidates is Matt Bevin, a self-made businessman and expert in finance from Louisville. Matt Bevin suffered a defeat in the 2014 mid-term elections against Mitch McConnell in the Republican Primary. Despite Bevin’s lack of any political position prior to his run for Senate, he was still able to raise an impressive $4,496,251 in contributions, although $1,250,000 was money that came straight from himself (Federal Election Commission). Many people believe it was a mistake to have ever challenged McConnell to begin with, as his donor list is very long and he hadn’t made any particularly negative political blunders in recent times that were ripe to be taken advantage of in 2014. As of now, Bevin could still be using funds from his Senate campaign to finance his run for governor, we can’t know because KREF doesn’t have a finance report on file at this time (Kentucky Registry of Election Finance).

bevin

Matt Bevin’s strong suit for campaigning is his familiarity with technology. His campaign website could easily be on a Top 10 list for greatest campaign websites of all time. It is clean, modern, and very easy to navigate; making it clear where a visitor can go to contribute. It is expected that he will place a great deal of emphasis on the usage of technology in his primary campaign to reach the voters that he needs to reach, using public records coupled with data processing software to develop short lists of the voters he needs to visit in person and those that he should feel good about soliciting for donations.

Bevin is also a financial expert. He has founded and managed several investment firms that are responsible for millions of dollars worth of Americans’ retirement accounts and pension funds. If the Kentucky pension crisis is an issue that dictates who receives the Republican nomination, Bevin stands a chance. Otherwise, Bevin will be afflicted by his “outsider” status that will encourage voters to steer towards Comer that has already had experience in government. Bevin also doesn’t feel as relatable as other candidates. Voters could potentially see him as a businessman first and leader second, counteracting any relatability he has accrued through his persistent broadcasting of his time in the military and time on the farm. His demeanor at the Lincoln Day Dinner on March 7th corroborated this as well. Much of his speech was talk of his involvement in finance and his various businesses that range from the production of medical devices to doorbells. Matt Bevin faces a very tough campaign to secure the Republican nomination. His success is within the realm of possibility if James Comer were to slip-up, but it is unlikely at this time.

Another “contender” for the Republican nomination is Will Scott, Pike County native and Vietnam War veteran. He completed his JD in 1974 and practiced law privately in Florida and Kentucky for a majority of his professional life, until he was elected to the Kentucky Supreme Court in 2004; which he served on until 2010 (Kentucky Court of Justice). His decision to enter this race is particularly interesting, as Scott has little to no name recognition outside of Pike County, and he will be competing against some very strong opponents.

Scott’s platform is also unique. Perhaps his biggest issue that he is pushing is dissolving the state healthcare exchange that was established under the Affordable Care Act last year, saying, “The only thing we get out of surrendering on ObamaCare is Barack Obama’s appreciation. . . My primary opponents already gave up that fight last summer telling the Chamber of Commerce what they wanted to hear. I got in this race to provide leadership, not to go with the flow. The only thing we are getting out of a state-run ObamaCare exchange is the privilege of paying for it,” (RedState.com). Scott also supports expanded gambling as a last ditch effort to help the ever increasing unfunded pension liabilities of the state, while in nearly the same breath supports reducing the corporate tax income rate; citing an assumed economic expansion as the reason why no one should worry about the tax cuts. Unique for a conservative platform, however, is his strong emphasis on state provided drug addiction rehabilitation programs, and a focus on increasing the efficiency of the state judicial system (Brammer). Perhaps his time behind the bench has lent its hand in promoting an empathy with downtrodden citizens that have drug problems.

Will Scott is not widely viewed as a serious contender in this year’s race. In what little polling has been done at this time, he has polled dead last for likely Republican voter’s choice in the primary, and far behind the others at that (Harper Polling). Additionally, Will Scott has yet to either raise any money, or file his finance report, as KREF shows his current funding at $0 for the 2015 primary (Kentucky Registry of Election Finance).

Louisville businessman Hal Heiner has already proved that he will be a serious challenger in this year’s gubernatorial race. Heiner is a lifelong Kentucky resident, and was educated at the University of Louisville where he earned a Masters degree in engineering. He has had a limited political career thus far, serving on the Louisville city council for eight years and chairing various boards like the Kentucky Charter Schools Association and other religious organizations (Hal Heiner for Governor). This is a bold step outside of the conventional progression from state legislator to governor, and this may work to Heiner’s disadvantage.

heiner

Heiner’s platform focuses almost explicitly on fiscal issues: “Accountability Budgeting, Jobs & Economy, and Fighting Washington Bureaucratic Regulation,” (Hal Heiner for Governor). Heiner’s platform may be the most resonant among Kentucky voters that are looking for a candidate that will correct the fiscal mess past administrations have gotten the state into. The people of Kentucky are becoming more aware of the debt problem as the General Assembly continues to kick the can down the road, refusing to make the necessary cuts or raise the necessary revenue to fund the pension system. This is an issue that Heiner is sure to spend an enormous amount of time on, and an issue that will be a wise time investment for his campaign, as it will produce positive results for Hal in the polls and ultimately, the primary.

Despite Heiner’s almost pinpoint accuracy in identifying the issues that will incentivize voters to rally behind him, he has repeatedly shown a great deal of hostility towards the Affordable Care Act and the Medicaid expansion. Heiner seems to ignore that, at the end of 2014, over 520,000 Kentuckians have signed up under the new healthcare law (Modern Healthcare). To constantly assert that he will fight Obamacare will be to alienate a half million Kentuckians that have benefitted from the law, potentially losing thousands of votes. If there is one position that he should re-evaluate, this is it.

A campaign message that Hal has, and will continue to milk for all its worth, is that he is an accomplished businessman that has created over 4,000 Kentucky jobs (Hal Heiner for Governor). He cannot be blamed for repeating this either, as it’s a claim very few politicians, even on the national level, can make. His emphasis on job creation and economic problems is something that create positive results for Hal’s campaign; it’s a message that Kentuckians still want to hear and a message that Hal’s track record indicates is a problem he is proficient at addressing.

Heiner is by far the most well funded candidate in the race, and has already launched an intense media campaign, flooding most local channels with campaign ads to the tune of $1.1 million in campaign disbursements as of the end of 2014. According to the most recent campaign finance report, he has raised over $4.6 million, eclipsing the combined total of every other candidate in the race that we currently have data for. However, Hal Heiner is a very wealthy individual, and it is important to note that about $3.9 million came from him personally. Despite this, he has raised $700,000 from others, which is an impressive feat nonetheless (Kentucky Registry of Election Finance). This Republican primary will be a good experiment to determine if a lesser-known candidate is able to buy their way to Frankfort. If Heiner wins the primary, it will be for this reason.

Lastly, we have Department of Agriculture Commissioner James Comer. Comer is a native of Tompkinsville, Kentucky, and began his political career in 2000 when he was elected to the Kentucky House of Representatives, which he served in until 2012 when he announced that he would run for Agriculture Commissioner. Comers early publicity and popularity stem from his audit of the Department, which lead to the ultimate downfall of his predecessor Richie Farmer who was sentenced to serve twenty-seven months in prison on corruption charges (WKYT). This was a massive win for the Comer camp, and was arguably the political seed that Comer was able to plant in Kentuckians’ minds: he is the one watching out for you in Frankfort, he will prevent wasteful spending, he will protect Kentucky from corrupt officials.

comer2

Comer also has “good-ole-boy” appeal. He was raised in a farming household and came from humble roots. He is a graduate of Western Kentucky University, where he earned his Bachelors in Agriculture, and has been a lifelong farmer of a multi-thousand acre grain farm (Kentucky Department of Agriculture). More importantly for political purposes however, Comer has always pushed a relatively moderate message; never too extreme to foreclose support from the other side of the aisle. This has been one of his greatest strengths: the ability to appeal to voters from both parties, leading to overwhelming victories in the elections in which he has been on the ballot. However, as the primary draws closer, we do see him radicalizing his platform, e.g. promising to outright ignore the EPA’s new regulations on carbon emissions if he is elected (Comer for Governor). This is what he must do, however, to win the Republican nomination. He will surely push a message more in line with what he has historically pushed after/if he wins the primary.

Commissioner Comer’s platform is fairly stereotypical for a conservative candidate. There is a large emphasis on jobs, although this has lost much of its appeal since the economy has since experienced explosive growth over the past two years and pre-recession levels of employment. Interestingly, Comer also focuses on a couple of social issues, maintaining the status-quo with regard to second-amendment rights and also making abortion illegal (Comer for Governor). Second Amendment rights are something nearly every American will support, but his stance on abortion may drive away some of the support he currently gets from liberals. He could arguably do better without making this an issue, but there is the chance that he personally feels that it is worth fighting for.

Comer’s platform is centered on his hostility towards wasteful government spending, and reckless decisions made in the past by the General Assembly that have left Kentuckians in a terrible fiscal state. He wants to audit the entire pension system, following his own lead from 2013 in the Department of Agriculture, and expose mismanagement and waste. He also seeks to privatize the management of the fund, which he believes will save money and also produce better results. Comer has also struck a perfect balance on the issue of the Medicaid expansion and the Affordable Care Act. He concedes that he has always opposed the program, but it is too entrenched at this time to remove. Thus, he seeks to discourage enrollment, encourage people to visit a primary care physician instead of the emergency room, and also require re-enrollment in Medicaid every two years. These policy decisions will have a positive impact on the fiscal problems of the state, and they still send a strong message to his supporters that he opposes any socialized form of healthcare (Comer for Governor).

In recent polling, Comer has shown promise. In two of the three polls that have been conducted, Comer was in the lead over Heiner, Bevin, and Scott with a comfortable margin; though as time has progressed it seems as though Heiner’s early money has moved the needle his direction. We can expect Comer to regain some lost ground as his media campaign is launched in mid-March. In one of the three hypothetical polls pitting him against Attorney General Conway, he held a 4 point lead. This was the biggest lead any Republican candidate held over Conway in any of the hypotheticals, but his loss in two of the other polls should be cause for worry (Ballotpedia). Comer still has a great deal of campaigning to do if he hopes to defeat Conway in the general election.

As for funding, Comer has been undeniably successful in his fundraising thus far, and as of December 31st, 2014, he has raised about $1.1 million for the primary (Kentucky Registry of Election Finance). What makes Comer’s strategy unique, is that he held out spending this money for as long as possible, citing that he wanted to wait until he had enough funding that he could launch a media campaign and never stop until the day of the primary (CN2). Comer presumably has some very talented campaign consultants on his side that have helped him win many races in the past, and we can expect precision campaign finance strategy coming from his corner in the months to come.

Screen shot 2015-03-15 at 10.16.19 PM

Recent polling suggests Heiner is pulling ahead, but Comer’s media campaign should bring him back closer to the front of the pack (Ballotpedia).

THE DEMOCRAT FIELD

From the Democratic Party, there are two candidates that have declared their candidacy. First is retired engineer Geoff Young of Lexington that suffered defeat in 2014 during the primary for the sixth congressional district seat. Although he is very well educated, a B.S. in economics from M.I.T., a Masters in mechanical engineering, and a Masters in agricultural economics, he has consistently shown that he performs very poorly in elections (Ballotpedia). His campaigns are characterized by a much too progressive platform, and ineffective campaign strategy. Unfortunately for Geoff, thus far he has only been able to raise $3,500 in his pursuit of the Democrat nomination (Kentucky Registry of Election Finance). Young is not going to be a serious contender in the race, as supported in both the Harper and Bluegrass polls conducted over the last few months than have shown Attorney General Conway with a 50 point lead (Ballotpedia).

Finally, our last candidate for governor on the Democrat ticket is current Attorney General Jack Conway. Conway has had an overall successful political career this far, with his only recent setback occurring in 2010 when he narrowly lost his run for Senate against Rand Paul. He has thus far spent the majority of his professional life in government, with a brief stint in private practice from 2001-2007, after which he ran his first campaign for Attorney General (VoteSmart).

conway

Conway’s strength is his undeniable successes as Attorney General, where he has put countless criminals behind bars, and recovered hundreds of millions of dollars for the state (Conway Overly). He has an arguably spotless record, with no obvious political blunders that could come back to haunt him in this race. His competition may be retaining an ace-in-the-hole for use later on in the campaign, however, just as Conway attempted to do with Rand Paul in 2010. Also working in Conway’s favor is his likability and generally humble attitude. Despite his time working as a lawyer, which has a tendency of removing an individual’s “small-town feel”, Jack has somehow managed to maintain this throughout his career. He still seems easy to talk to, and he still seems easy to relate to, albeit not nearly as much as James Comer. Still, he will have no difficulty making a personal connection to voters.

Conway has proven his worth this election, so far having raised $1.3 million in pursuit of the office. Because he has no serious competition in the primary, this will be incredibly advantageous to Conway in that he will be able to save his primary funds for the general election; all the while his Republican opponents will be forced to use their primary funds to compete with each other. In support of this point is this fact that Conway has only currently disbursed $373,000 of his $1,300,000 in funding, likely just outlays to set up his initial organization and pay retainers to consultants (Kentucky Registry of Election Finance). Conway will be able to get by with spending less, and also spending less time fundraising, which means more time with voters.

In the current race, Conway’s platform focuses on three main issues: education, attracting businesses, and infrastructure investment. For education, he really doesn’t provide specifics; citing a need for “early childhood education,” and the need to “reduce higher education costs” without ever providing an answer as to how the state could afford more investment in schools. His emphasis on attracting business is also very vague. He does mention “redesigning incentive packages” as a means to lure business, but it’s hard to imagine that meaning anything other than lowering the corporate tax rate, which his base would not be particularly fond of. His inclusion of a focus on business as one of his three primary campaign issues also feels like it’s only there to possibly steal voters from the right, who are more likely to focus on fiscal rather than social issues. Lastly, Conway emphasizes the need for infrastructure improvement. He claims we will build “new roads and bridges,” but in this claim is a serious problem (Conway Overly). Conway seems to overlook the fact that Kentucky has a massive pension and debt crisis, with $17.6B in unfunded pension liabilities (The Courier-Journal). Kentucky’s debt continues to grow at an alarming rate, and Kentuckians are waking up to our severe problem. This may cause voters to think twice before blindly jumping behind Conway’s potentially empty promises. These claims will have to be backed up with new sources of revenue, or a mass overhaul of the current funding system to sell this platform to fiscally conscious voters.

Screen shot 2015-03-15 at 10.19.26 PM

Polling shows a clear victory for Conway in the primary (Ballotpedia).


OTHER INFLUENCES

One major consideration to the 2015 governor’s race is how popular the independent candidate eventually becomes. At the time of writing, Drew Curtis of Versailles is the only independent candidate to have declared his candidacy. Abrasive in nature, Curtis is a feisty candidate; confrontational and not scared of a fight with the establishment from either side. Speaking in an interview in mid-January, he says one of the major reasons he is running for governor is “this sinking feeling that nobody is doing their damn jobs at the political level,” (Nichols). Curtis’s entrepreneurial success is traceable back to his creation of Fark.com, a news aggregation website that was one of the most popular places to visit on the Internet in the late 90’s and early 2000’s. He still maintains total ownership, although Fark’s popularity has lost most of its market-share to other online news sources. As for his campaign funding, there is a good indication that Curtis is independently wealthy, but as of now he has not filed his finance report with KREF (Kentucky Registry of Election Finance).

Foundational to Curtis’s platform is his hostility towards politicians and political parties in general. From his campaign website, “This is our chance. But it takes everyone’s help to make it happen. We are standing up against career politicians, political parties, special interests, and every group that thinks they deserve more influence than you,” (Drew Curtis for Governor). His campaign seeks to capture votes stemming from anger at the status quo, and dissatisfaction with the political gridlock that has plagued the country over the last four years. Curtis also makes mention of the net-neutrality issue, one that is important to many Democrats, pulling more of them in his direction.

Drew Curtis will have an impact on the gubernatorial race, as independents almost always do. Independent candidates serve as a catchall for anyone who does not prefer either of the candidates from the Republican or Democratic parties, and though independents rarely win, this effect has the potential of changing the outcome of the election. This is very relevant in the case of Drew Curtis, as his platform seems to aim more towards the liberal left than the conservative right.

If Curtis doesn’t campaign on more conservative issues in the upcoming months, there is a strong possibility that he will split the Democratic vote much more so than the Republican. Given that the margin we see in current polls is otherwise slim between Conway and the eventual Republican candidate, Curtis’s presence alone could change the outcome and give the Republicans Kentucky.

CONCLUSION

            Those familiar with Kentucky politics know that there is a tendency for Kentuckians to elect a Democrat governor, despite the partisan composition of any other branch of Kentucky government and Kentucky’s federal delegation; Kentucky has had only two Republican governors in the last sixty-eight years (National Governors Association). However, there is the theory that this general partisan shift towards the GOP will reach a critical mass again, leading Kentuckians to elect another Republican governor. Ernie Fletcher could be viewed as the early signs of this, and for all we know the conservative movement could have taken hold with Fletcher if he hadn’t been so embroiled in scandal for the latter half of his term.

What hypothetical polling we do have at this time for the general election shows Conway, on average, winning against every Republican candidate (Ballotpedia). There is still the better part of a year before voters will make that decision, which will also work in favor of Conway’s organization because he does not have to spend any money on the primary. Another very important consideration is that a massive piece of the electorate is still undecided. Anything could happen between now and then, and it is important that Conway doesn’t get complacent in his lead. Although all the signs are pointing at a Democrat victory, his competition is incredibly tough and in at least one case much more funded than he is. Let’s continue to keep our eyes on this governor’s race, as it is sure to be exciting in the months to come.

-Tyler

SOURCES

Ballotpedia. Geoff Young. February 2015. 10 March 2015 <http://ballotpedia.org/Geoff_Young&gt;.

—. Jack Conway. March 2015. 15 March 2015 <http://ballotpedia.org/Jack_Conway&gt;.

—. James Comer Jr. March 2015. 15 March 2015 <http://ballotpedia.org/James_Comer,_Jr.&gt;.

Brammer, Jack. Former Kentucky Supreme Court Justice Will T. Scott enters GOP primary for governor. 13 January 2015. 9 March 2015 <http://www.kentucky.com/2015/01/13/3639253_former-kentucky-supreme-court.htmlpy&gt;.

CN2. Comer Feels Good Heading into Final Months of GOP Primary Campaign. 5 March 2015. 15 March 2015 <http://mycn2.com/politics/comer-feels-good-heading-into-final-months-of-gop-primary-campaign&gt;.

Comer for Governor. Comer Will Ignore EPA Carbon Emission Rules. 11 March 2015. 12 March 2015 <http://jamescomer.com/2015/03/comer-will-ignore-epa-carbon-emission-rules/&gt;.

—. Government Spending. January 2015. 12 March 2015 <http://jamescomer.com/issues/government-spending/&gt;.

—. Pro-Life. January 2015. 12 March 2015 <http://jamescomer.com/issues/pro-life/&gt;.

Conway Overly. Conway Overly KY Media. 7 March 2015. 10 March 2015 <https://conwayoverly.com/media/&gt;.

Federal Election Commission. Details for Committee ID : C00547547. 31 December 2014. 9 March 2015 <http://fec.gov/fecviewer/CandidateCommitteeDetail.do&gt;.

Hal Heiner for Governor. Our Campaign. 2014. 11 March 2015 <http://www.halheiner.com/our-campaign&gt;.

Harper Polling. RunSwitch/Harper Polling Kentucky Governor Election Poll. 31 January 2015. 9 March 2015 <http://harperpolling.com/polls/kentucky-governor-poll&gt;.

Kentucky Court of Justice. Supreme Court Justices – Justice Will T. Scott. 15 August 2011. 9 March 2015 <http://courts.ky.gov/supremecourt/justices/scott.htm&gt;.

Kentucky Department of Agriculture. Office of the Commissioner. 10 March 2015. 12 March 2015 <http://www.kyagr.com/commissioner/&gt;.

Kentucky Registry of Election Finance. Finance Statement. March 2015. 13 March 2015 <http://www.kref.state.ky.us/krefsearch/&gt;.

Modern Healthcare. Kentucky Gov. Beshear on why Obamacare will become like Medicare. 2014 October 2014. 11 March 2015 <http://www.modernhealthcare.com/article/20141029/MAGAZINE/310289962&gt;.

National Governors Association. Governors. 2011. 15 March 2015 <http://www.nga.org/cms/governors&gt;.

RedState.com. Only One Kentucky Candidate to Reverse Obamacare. 1 January 2015. 9 March 2015 <http://www.redstate.com/diary/davidadamsinky/2015/01/30/one-kentucky-candidate-reverse-obamacare/&gt;.

The Courier-Journal. Pension Crisis Demands Action. 2 June 2014. 10 March 2015 <http://www.courier-journal.com/story/opinion/editorials/2014/06/02/pension-crisis-demands-action/9881045/&gt;.

VoteSmart. Jack Conway’s Biography. November 2011. 10 March 2015 <http://votesmart.org/candidate/biography/35236/jack-conway#.VP-wCGYp8pE&gt;.

WKYT. Comer navigates Richie Farmer backlash. 8 September 2014. <http://www.wkyt.com/home/headlines/Comer-navigates-Richie-Farmer-backlash-274383071.html&gt;.