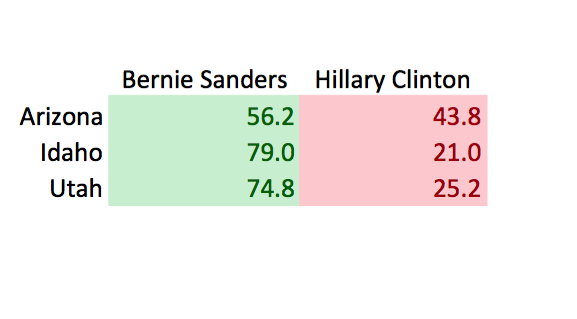
Sanders search interest has fallen dramatically in Arizona over the past two days, and it remains to be seen if this will have a significant impact on the results tonight, but this same rapid downward search trend happened in Minnesota and did not ultimately change anything. Meanwhile, search interest for Bernie in Idaho and Utah is through the roof. Here are my final estimates for tonight:
 Hillary’s greatest advantage at this time is likely all of the early ballots that have been cast in Arizona. Other states have shown us that residents who are proactive enough to cast early ballots seem to vote disproportionately for Hillary Clinton (older people, of course). Who knows if this trend will hold true in Arizona, though I imagine it will.
Here are some charts to demonstrate a few relationships between variables.
In all charts, the Y-axis is the %Vote Share of Bernie Sanders.

The chart looking at Facebook like proportions should demonstrate that Bernie’s current “polling average” of ~23% in Arizona is not reflective of reality. Bernie almost has to land somewhere between 45% and 63% because this is such a strongly correlated variable.
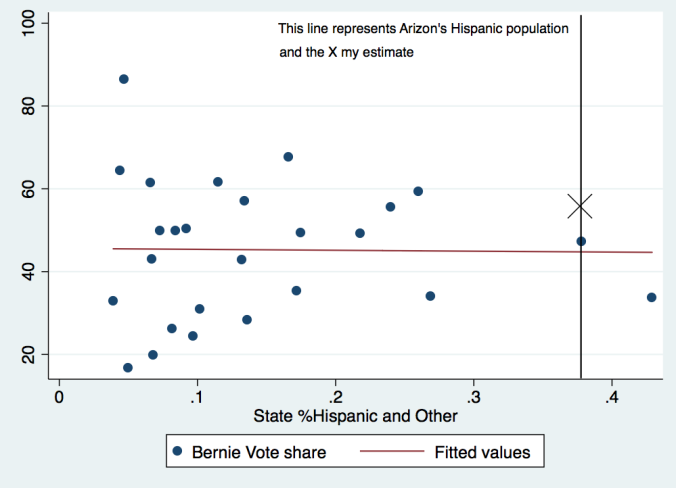
Hopefully this convinces at least a few people that what I am proposing with Arizona is not in any way a radical idea. As you can infer from this chart, in general, Hispanics don’t tend to vote for Hillary or Bernie in America. There is actually almost perfectly no correlation.
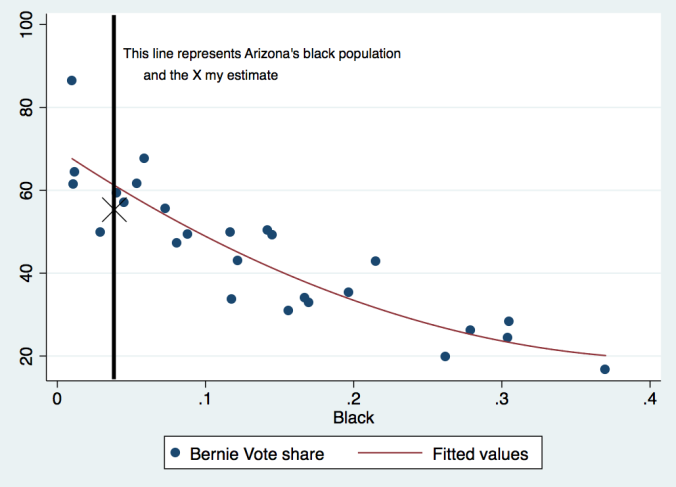
As for the %Black variable, and as you can see in that chart, I am actually estimating Bernie to under perform with regard to it. Bernie almost has to land somewhere between a 48% to 75% interval because this variable is also so strongly correlated with vote share.
Thanks for all of the interest,
Tyler

Please post your predictions for tomorrow! I would really appreciate it and am looking forward to them!
LikeLike
I think he said he had midterms today, so he’d post them later
LikeLike
Would love to see your Washington, Alaska, & Hawaii projections soon! Thank you! 🙂
LikeLike
Any time frame on when tomorrow’s contests predictions will be posted?
LikeLike
I feel that your prediction for Arizona should have been spot on but it’s an under statement to say that the early voting helped #whichHillary win in that state. Add in the shenanigans created by the Republican led effort to limit voting and that explains things. I have to imagine that they wanted to limit the Latino vote more to help Trump than #whichHillary. She just happened to benefit from it this time around too. Then add in the fact that it was a closed primary. I know you think closed primaries are better for Bernie but I disagree. He typically does better wherever independents can vote… like Michigan! What happened in Arizona last Tuesday was a shame. Just like in Ohio. Think about it. With less than 1% of precincts reporting main stream media puts out the early vote numbers and declares a #whichHillary victory. They did a similar thing in Ohio. In the flash of a light, before any precincts reported, they started giving counties to Hillary. With 4% of precincts in they declare a Hillary victory. I think the vote fraud is much worse than people even know. Look at how badly his numbers were in Florida vs North Carolina. Nearly every major poll showed him doing worse in NC than in FL. The DNC is purposely rigging certain state totals. They don’t need to do it to all either. They can let Bernie win a few. They just can’t let him win the Whitehouse. Just look at the exit polls in AZ vs the vote totals. Ask yourself which Hillary actually won in AZ, the one with record crowds at every turn or the one who has to cheat everywhere to win? The former doesn’t exist… so there’s your answer. Don’t be discouraged, it’s hard to see corruption when its decided by handshakes behind closed doors. We’re looking forward to your upcoming predictions.
LikeLike
Yo dude we’re ready for those WA, AK and HI projections whenever you are!
Think you were spot on about AZ, dont change the model at all, just give us what you’ve got!
Also an early projection for NY and PA would be dope
LikeLike
I hope you’re not giving up on your forecasts!
LikeLike
I hope he is not also!
LikeLike
https://www.change.org/p/barack-obama-replace-church-of-scientology-with-heb-on-guadalupe-street
LikeLike
Who is organizing the inquiry into how many voters that changed from independent to democrat to vote for Sanders in this primary had their voter registration electronically changed to NO AFFILIATION so that they couldn’t vote? “WTF?!?” you might say? Here is one example of just that happening:
http://heavy.com/news/2016/03/arizona-election-voter-fraud-bernie-sanders-azelectionfraud-provisional-ballot-maricopa-registration-long-lines/
LikeLike
Very accurate projections. Of course the election fraud in Arizona disguises your accurate projection there too. If we can have a re-vote there (as we should) with a reasonable amount of polling places in Maricopa County, I’m sure your numbers will bear out.
LikeLiked by 2 people
Give it a rest with this voter fraud nonsense. It affected both candidates.
When Bernie loses, it always excuses, excuses, excuses with your rabid supporters.
LikeLike
You’re correct. But you’r choosing to forget that this disproportionally hurts Sanders because a majority of older people already voted.
LikeLike
It’s not nonsense. Clinton clearly cheated if you look into what happened. Yes Clinton voters were turned away, but it affected Sanders supporters worse.
LikeLiked by 1 person
The long lines affected those who showed up in-person equally, yes, but the party affiliation “computer glitch” affected primarily Sanders supporters. The Sanders database hack that happened last weekend, I suspect, may be related to that “computer glitch”.
When you have life-long Democrats (one known who was a former state Democrat Party official) have their registration changed without their knowledge — just before the vote — to unaffiliated, Republican, or Libertarian, making them ineligible to vote for their preferred candidate, something severely wrong has happened.
LikeLike
The deay problems would have affected Bernie more if more of the people who didn’t get to vote would have voted for Bernie. This heightened the impact of early voters who had voted before Bernie had much chance to advertise and appear in Arizona. These early voters were a bigger percent of the total vote than they would have been if election day hadn’t been such a screw up.
LikeLike
Hey Tyler,
Not sure if you ever take into account election fraud. There is SO MUCH election fraud that happened in Arizona today. Everything that could have gone wrong, went wrong. I do think your model is accurate and the reason why Arizona is off, is because of the amount of people who were turned away, were told they were not registered when they have been registered for months, the people who were told to go home after waiting in lines for hours, etc. I think if all this shady stuff that happened by the Clinton campaign hadn’t happened, that Bernie would have taken Arizona. I do think you were right on your projection, but you should keep in mind the fraud that happens sometimes.
LikeLiked by 2 people
Spent some time looking at the voter suppression issues from last night – they are definitely real but people have to understand NOW that the decisions that led to this were 100% made by Republicans who run the election apparatus in the state. For example, Latinos were hurt more than most others by the reduction in polling locations – many poor and predominantly Latino districts in Phoenix didn’t have a single polling location. This doesn’t necessarily hurt Bernie, it should have hurt Hillary. Bernie lost because of the closed primary. This election is fair warning to Democrats that the GOP has been preparing to make sure the state is solidly in line for the Republicans in November, even if the nominee is Trump. Arizonans have 7 months to get this fixed.
LikeLiked by 1 person
Spoken like someone in denial.
LikeLike
Hi Jennifer, I love this response. You acknowledge the election fraud that threw off the election and gave it to Hillary. And then you actually ask Tyler to account in the future for fraud! 🙂 As if anyone, brilliant mathematician or not, could account for cheating that is specifically designed to ensure one candidate wins. No ethical person would actually assume there will be cheating, suppression, and fraud. 🙂
LikeLike
Tyler, your prediction for Arizona was wrong because it was a closed primary. I know it’s probably obvious but my point is that this is not an indicative that your model is faulty; you simply missed a very important variable. Make sure you take this into account for the future, and also for what happened in Florida. I don’t buy the “Florida is deep south” thing.
LikeLike
What happened in FL happened not because it’s deep south, but because of the very old population plus the low white population plus it was a closed primary. If he accurately accounts for close primarys this model will work like a charm like it did for Utah and ID.
LikeLike
Many people have been saying that his projections would more accurate if he accounted for closed/open primaries accurately. However, and Tyler can correct me if I’m wrong, I believe he actually gives Bernie a disadvantage in open primaries due to dem voters going Anti-Trump. He said this after Ohio in one of his blog posts. He thinks open primaries actually hurt Bernie.
LikeLiked by 1 person
It’s important to also note that there was a large early voter turnout in Arizona. They hold records for early turnout. That’s another strong variable you perhaps missed on?
However, Utah and Idaho were right on point. Good job, Tyler! Keep up the good work and keep posting here please, I enjoy your analysis on the democratic election.
LikeLike
At the moment it looks like Tyler nailed Idaho and Utah and missed Arizona by a mile. Hitting two states at over 70% is actually pretty cool but of course everyone will focus on why he missed Arizona because that’s where people thought they were gonna make a killing from the model. Of course this is a free website, with no subscription fees so buyer beware :). But I agree that to get this to the next level it’s got to go beyond a black box regression model that is devoid of political analysis. It’s just as important to know why Idaho and Utah worked (as well as the others) as it is to know why Arizona didn’t… Obviously there are additional political issues in play in Arizona that don’t come into play elsewhere. For one thing after seeing how Indies have had huge impacts on the results of primaries in several states (notably NH, MA, and OK) it’s hard to understand how the inability of Indies to vote in AZ wouldn’t have been picked up in the model. Another clear difference is the Hispanic population. Tyler said Hispanics don’t tend to vote for Hillary or Bernie in America – but I think that’s likely just a set of offsetting differences in the states, and that Hispanics of different types do vote differently. They’re not a single category. In heavily Hispanic states it’s critical to get a political sense of the Hispanic vote, not just a model sense, because the correct model data is scarce or will not exist in adequate form.
If this is played right, and the political issues that are leading to both the success and failure of the model are identified, then this will be an exercise that was worth having, otherwise it will just be an interesting artifact of Facebook and Google data that will never be adequately understood as being predictive or just lucky..
LikeLike
There is a lot of cases being reported in Arizona on fraud/voter suppression as well as people being turned away. It doesn’t help that polling places have signicantly decreased with each election which is favoring early voting and in turn Hillary Clinton winning.
LikeLike
It’s called fraud/disenfranchisement/suppression and no pollster who is ethical can factor that in.
http://usuncut.com/politics/5-examples-voter-suppression-arizona-primary/
LikeLike
Great projections! Extremely accurate! Welcome to reality!
LikeLike
He did great in 2 States, nearly spot on in both, but he completely muffed it in Arizona
Right now his model is decent, but flawed.
Sometimes it produces spot on results better than any poll
Sometimes it completely misses the ballpark by a mile..
He needs to keep working on his system, try and find out what is causing the big misses, he may have to begin introducing new data into his system
LikeLike
Tyler needs to incorporate electoral fraud into his model.
LikeLiked by 1 person
Well everybody is saying Clinton won big based on early voting. I sure hope your model proves that all those voters standing in line are Sanders voters. It sure seems like a lot of voter disenfranchisement so I don’t know how you model for that.
LikeLike
Wish you were right about Arizona. This sucks. Your site gave me hope before Super Tuesday last week, and again on this week dude. And now that hope is gone.
LikeLike
Yikes. Early results have Bernie getting crushed in AZ:/
LikeLike
Already projected as the winner….
LikeLike
Why on Predictlt.org has Hillieary clear lead now 86:16? Thanks for response Tyler.
LikeLike
Where are you getting your facebook likes data?
LikeLike
Tyler, you think Bernie really certainly wins Arizona? I hope, he will be on min.51%.
LikeLike
Why not do this for the Republicans as well to test the predictive power of your approach?
LikeLike
Tried it. After dozens of hours of work on a few GOP models the elections last week destroyed them all
LikeLike
How can you get the data: FB likes by state?
LikeLike
I did regression analysis and a county-level model of around 1800 counties. I have written up my analysis:
http://www.campusactivism.org/blog/node/437
Currently my (very suspicious) model has Clinton winning all of the next six states. I suspect my model is better at county predictions than state ones (as the final Adjusted R^2 is 0.78). I’m also using Google Search Trend data from Jan 1 – March 20, 2016. Is there a reason to use a shorter and/or more recent time frame? I’m guessing it depends when voters make up their mind.
My latest model actually has Bernie doing better with Hispanics (than Whites). Of course this is actually that he does better in *counties* with Hispanics (it may be that white people in those counties are more likely to vote for him). And this is a distinction that we often forget, and also applies to state models like your’s.
What variables are you using in your full model? My main ones are race, education, Google Search Trends, age, sex, and polling data.
I’d be happy to discuss models over email! — aaron@campusactivism.org)
LikeLike
Make sure if you use Google Trends data to use a relative measure averaged over a few days immediately prior to the election in question. Longer and shorter time scales are pretty much meaningless. I’ve found the 3 days prior is the most predictive measure
LikeLike
Re: Aaron Kreider, I was wondering when someone was going to bring up the notion of ecological fallacy. What is true at the state level may not be true at the individual level. It seems to certainly be true for our Republican friends (where Trump does well in states with large numbers of blacks, although assuredly it is not blacks who are voting for him).
That said, Facebook “likes” alone are strikingly correlated with outcome at the state level (with race and age of the populace as weaker, but nonetheless independent, predictors). Looking forward to results tonight!
LikeLike
Nice Stata blog 🙂
LikeLike
The early voting results are not indicative of actual votes. More so it is indicative of just how effective vote tampering methods are in electronic voting machines. I get a bit weary of so many people and media sources suggesting that Hillary has a clear win among early voters. A vast majority of states and counties showing a now easily predictable margin in the area of 90% vs 10% regardless of demographics does not reflect actual real-world, in-person, personal observations, and completely impossible election results.
As an example, I had attended three different early voting events, two of which were organized by and consisted of entirely Bernie Sanders supporters, all stating that they had cast their vote and that they voted for Bernie Sanders. In the third of such events, only 14 people were present and 9 of them strongly proclaimed their reasons for wanting Sanders to win the election, but the other two events had more than 60 people in the first, and well over 100 in the second, yet, the county voting results say that only 65 people in a county of over 200,000 voters, voted for Sanders.
LikeLike
If this is true, this should be bigger news. There’s absolutely no way he could received only .0325% of the vote in a county that big.
LikeLike
I’ll make this short: “The plural of ‘anecdote’ is not ‘evidence’.”
LikeLike
He’s saying that he personally attended events at which in excess of 175 people formally voted early for Sanders, and yet his county only registered 65 early Sanders voters. That’s not a problem with using anecdote as evidence, that’s a signal that over 100 actual votes were miraculously not registered.
LikeLike
I’ve never really worked with statistic and predictions, but are your numbers derived from a large amount of linear regression models like these? I always assumed there was very complex statistics behind it. In reading some stuff Nate Silver posted it seemed pretty simplistic as well, is this because complex doesn’t always=better or is there just not enough data/some other reason that modeling isn’t a very complex interaction of tons of variables?
LikeLike
I think because most variables tend to have low impact, because they aren’t strongly correlated with the outcomes.
So most variables can be ignored and only the important variables are necesaary.
At least that’s what I think is the case.
LikeLike
I guess my question is more along the lines of, is the final projection an average of a few notable variables that each have their own correlation with past results and a resulting trend line, or do the variables interact in any way… for example, do you simply average the correlation of Facebook posts, demographics, and google trends, or do the demographics, Fbook likes and google trends all work together, making themselves more accurate. Say in Florida lots of young people liked Bernie on facebook, but older people showed up to vote far more often, would future states with a disproportionate amount of old voters have less weight on the facebook trends? Or maybe the demographic of old voters in that state not be as significantly affected? Anyways, I have no idea if what im saying is possible or effective, just some ideas I have. Probably did a terrible job articulating that as well. Let me know if you need clarification.
LikeLike
How are you coming up with these numbers? I sure hope you’re right! #FEELTHEBERN
LikeLike
I think he uses FB, Google trends, etc.
LikeLike
Which are ridiculous indicators to use, as the results tonight are showing. Might as well put moon phase in there.
LikeLike
what do you think the cause is of the drop in search interest in AZ?
LikeLike
Interesting, I spent some time phone banking for Bernie in Arizona and found mostly all to be Bernie supporters from a list of people from all parties. Many had already voted, lots young early voters, so maybe the drop in interest.
t.
LikeLiked by 1 person
Has Bernie’s search share fallen off in other states that he’s won and lost?
Any differece between the two that indicates which way Arizona is going?
Has Bernie been gaining or losing FB likes in Arizona recently?
In Nevada and Colorado Bernie likely won Latinos, but in Texas he lost them, do Latinos in Arizona more lean more like Texas Latinos or like Latinos in Nevada?
LikeLike
Latinos in Arizona are quite a special case from the ones in the Texas and Nevada. In Nevada, and Texas, Latinos are treated relatively well by both establishment parties.
Texas Republicans were smart and decided to include Latinos into their party tent. Thus you will find fewer Mexican-Americans in Texas who will vote Democrat, and those who do will be marginally more conservative. Arizona on the other hand pulled off a Pete Wilson and decided to disenfranchise and alienate the Mexican population, which galvanized Hispanics into voting for Democrats.
What differentiates Nevada and Arizona Democrats is that Nevada is home of the Reid establishment, and thus many Latino leaders and organizations decided to back Hillary Clinton. Arizona has been the opposite case, where a handful of Latino leaders, and organizations here decided to back Sanders because he is the most progressive candidate regarding civil rights and anti poverty measures.
LikeLike
Alex, what you’re describing is a great reason why you can’t just automatically treat each state like every other state. Any regression model will break as soon as the underlying political dynamics of change in a material way vs. what’s come before. The only way to stay ahead of that is to understand the model not only from a purely numerical perspective (represented by Facebook and Google Trends data) but also the political differences in each state – and that’s where the art comes in and can sometimes help avoid a big bust.
LikeLike
Only Minnesota has it fallen like this and he still won there. Really threw me off.
LikeLike
Great to see the data, and easy to agree with. Since you say that early voters tend to overwhelmingly vote for Hillary, does that play at all into your projection? Thanks.
LikeLike